Monday, December 28, 2015

Find subset with same mean

In this post the following problem is posed:
Given a set of numbers with mean μ0 find a subset of at most K numbers that has a mean μ that is as close as possible to μ0
Of course we try immediately to cast this as an optimization problem. The obvious MINLP formulation would be:


There are a number of interesting aspects. Not all of them are completely trivial.

We added a lowerbound of 1 to cnt (the size of the subset). This way we can safely divide by cnt. We could replace the division by a multiplication (this is the usual approach to protect against 'division by zero'), but in this case this is not needed anymore. Also note that a mean or average of zero numbers is not really defined, so this lowerbound really makes sense.

This model contains two non-linearities: (1) the objective is quadratic and (2) we have this division in constraint avg. Note that if we would only consider subsets of exactly size K our problem becomes much simpler. In that case cnt would not be a variable but rather a constant parameter and the avg constraint would become automatically linear.

An obvious but interesting question is whether we can linearize this model. The quadratic objective can be approximated by using an absolute value measure. Actually there is some monotic transformation between the quadratic and absolute value criterion. This mans we will reach the same optimal solution using the absolution value method as using the quadratic objective.

The division is more complicated. However we can note that we can rewrite equations count and avg as follows:


This can be linearized as follows:


As usual it is important to find good, tight values for the big-M's. In this case we can find reasonably good values:


where μLO and μUP are bounds on μ, e.g. μLO=min{vi}, μUP=max{vi}.

Now lets put everything together:
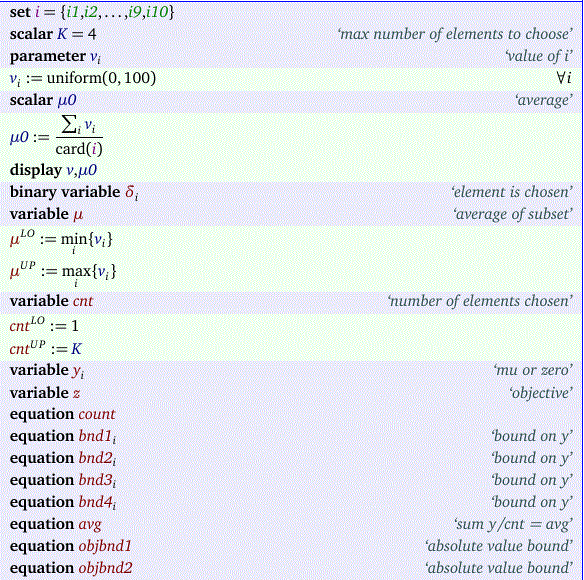


Here are some results:


We see that for K=5 we actually just use 4 numbers.

Saturday, December 26, 2015

Packing circles in a rectangle: a MIQCP model

An interesting problem was posed here. Given a set of circles (with given radius) try to cover as much area of a rectangle. Here the circles represent sensors.


The circles may look more like ellipses as the aspect ratio of the plot is not one (the plot is too wide).

It looks very difficult to me to develop a model that minimizes the uncovered (white) area in the above picture. We are dealing with overlapping circles and and circles that cover areas outside the rectangle.

However if we superimpose over the rectangle a grid with points, and try to minimize the uncovered points we may have a chance. In the model below we try to solve this by maximizing the number of points covered by at least one sensor:


Basically we model two implications and an objective:


For points inside circle k we don't impose anything, but leave it to the objective to drive things in the right direction. We repeat this trick in the second implication.

As this is a convex MIQCP, we can use some commercial solvers like Cplex and Gurobi. For large problems however this thing turns out to be not so easy to solve. The picture at the top of this post represents the optimal solution for the model with the small random data set of just four sensors.

Update

As noted in the comments, it may be better to exclude the points on the boundary of the rectangle. The result is:


Another approach would give those points a weight of 0.5:

Thursday, December 24, 2015

Non-convex QPs on a D-Wave Quantum Computer?

Here is an interesting suggestion for solving a non-convex Quadratic Programming problem.


See also this post.

Coloring

With some help from here I can now dynamically change the coloring scheme of the data points:
image imageimageimage
Here we color things according to z,y,x values and the distance to Utopia point (that point in the right upper corner). Note we are flipping the colors for the z axis. The reason is that, the z axis represents Performance which we maximize. The other quantities are all minimized. See http://yetanothermathprogrammingconsultant.blogspot.com/2015/12/visualization-of-large-multi-criteria.html.

Goat, wolf, cabbage

In this post the question was raised if we could solve the famous puzzle:

image_thumb[1]

(see: http://www.mathcats.com/explore/river/crossing.html). Here is my attempt:

image_thumb[3]

The ‘Eat’ table looks like:

image

This is based on: http://yetanothermathprogrammingconsultant.blogspot.com/2011/10/integer-cuts.html.

The equations look like:

image_thumb[5]

The results look like:

----     64 VARIABLE pax.L  items taken on each trip

                 wolf        goat     cabbage

trip1.L2R                       1
trip2.L2R           1
trip2.R2L                       1
trip3.L2R                                   1
trip4.L2R                       1

Note that empty trips are not displayed in this report. I.e. between trip1.L2R and trip2.L2R there was a trip trip1.R2L without passengers.

Friday, December 18, 2015

Visualization of large multi-criteria result sets with Bokeh

In http://yetanothermathprogrammingconsultant.blogspot.com/2015/12/visualization-of-large-multi-criteria.html we showed some 3D (interactive) plots using plot.ly. Here we look at a pair of 2D projections in Bokeh:

These are 2D plots of a large set of non-dominated (Pareto optimal) solutions with three objectives (Minimize Cost, Minimize Weight and Maximize Performance). As usual these projection plots are a little bit misleading. We can demonstrate this using an advanced feature of Bokeh: linked plots. When we select some points in the left plot, automatically the corresponding points are shown in the right plot:

This is also a Javascript based library, so these interactive plots live in a browser. With WebGL enabled, they render very quickly and the User Interface is quite smooth. See http://yetanothermathprogrammingconsultant.blogspot.com/2016/01/internet-explorer-webgl-bug.html for some problems with Internet Explorer.

With some effort we can color the points in these 2D plots according to the third dimension:

Thursday, December 17, 2015

Visualization of large multi-criteria result sets with plot.ly

Plot.ly is a great Javascript based visualization tool. Here I try to get a better understanding of a solution set of Pareto optimal points.

These are the results of a three objective Multiple Objective Mixed Integer Programming problem: each point is the optimal solution of a MIP. We plot here the objective function values, with the x coordinate representing Cost, the y-coordinate is for Weight and the z-coordinate indicates Performance.

In addition we trace here the distance between the Utopia point (best coordinate in each direction) and the Compromise point (closest feasible point to the Utopia point). This is the dark line between the two dark points. We can obtain the Compromise point using a MIQP model. In this special case we have enumerated all non-dominated points (for large problems that is not possible), and we can recover the Compromise points by just running through all points and selecting the one with minimum (normalized) distance. Distance is of course a somewhat difficult concept in this context, but users find this a useful tool.

Above we use the Performance to color the points. Below we have an alternative where we color the points according to their distance to the Utopia point.


The visualization is done inside the browser. It relies on WebGL. This seems to work with modern browsers on relatively new machines. Older machines may not work it looks like (may be hardware or configuration or outdated software). To try the interactive viewer, click here.

I got some help from from a Plotly engineer here. I can now change the picture using a small user interface in HTML.


Sunday, December 13, 2015

A Model with Semi-Integer variables

Not many times I encounter a model where I can use semi-integer variables. These are integer variables that are either zero or some value between LO and UP. I.e. x ∈ 0 ⋃ {LO,..,UP}.

The problem is as follows. We have N groups of people (the size of a group varies but is at least two) that we want to seat at M tables. Each table has a given capacity r. Finally we want no lonely people at a table: if a person sits at a table, there is at least one other member of his/her group at the table. Find the minimum number of tables needed.

One way of doing this:


Notes:

  • The assignment variables x are semi-integer. It is forbidden to have a single member of a group at a table.
  • The capacity constraint reduces the capacity of a table when it is not used.
  • The order equation makes sure we start using lower numbered tables. Also it reduces symmetry and may speed things up.

Thursday, December 10, 2015

Modeling languages vs Matrix Generators

A famous paper by Bob Fourer “Modeling languages versus matrix generators for linear programming  (ACM TOMS, 1983) discusses the advantages of a modeling language (AMPL) versus the (then) traditional way of building models: write some fortran code that generates MPS files. The “matrix generator” approach (now “matrix” taken literally) seems to enjoy somewhat of a comeback with languages like R and Matlab. Here are a few examples.

GAMS vs R/QuadProg

A standard portfolio optimization model minimizing risk can be stated as:

image

This is actually just a direct representation of the GAMS model:

image

The GAMS formulation is very close to the mathematical model. This model can be solved with any number of solvers, such as Cplex, Gurobi, Mosek, Conopt, Knitro, IPOPT, Minos and Snopt. They all accept the same formulation.

When we solve the same model using R and its QP solver from the QuadProg package, we need to look at how exactly the solver expects its input. Quadprog solves a problem of the form:

image

where the first meq constraints are equalities. We quite literally need to build up a matrix A:

image 

The generated matrix A looks like:

image

GAMS vs Matlab/QuadProg

In Matlab there is a similar function quadprog, but it has facilities to specify bounds on the variables. That allows us to simplify the setup somewhat.

image

Also note that this quadprog solves a slightly different problem:

image 

The documentation for the Matlab functions is excellent:

GAMS vs R/cccp

A different model deals with a nonlinearly constrained problem. Instead of only having a budget equation (sum of asset allocations is one) we also add a 2-norm inequality: ||x||2 ≤ δ. Such a norm constraint is discussed here. We could model this as a quadratically constrained problem (we get rid of the square root to make the model quadratic):

image

The GAMS representation is very much the same.

In R general purpose nonlinear programming problems are not so easy to set up as we need to worry about gradients etc. However we can solve this problem as a cone programming problem. A port of the CVXOPT system is available under R as cccp (Cone Constrained Convex Problems). Again, this means setting up matrices:

image 

This is very compact but not very self-explanatory. In addition we see that two very similar models but for different solvers require a very different approach.

Monday, December 7, 2015

1000 x 1000 assignment problem: 10 hours?

In http://stackoverflow.com/questions/34096450/how-to-increase-the-efficiency-when-you-have-1000x1000-matrix-in-excel a user reports that for a 1000x1000 assignment problem, OpenSolver takes more than 10 hours. I guessed that an LP/MIP solver should not take more than a few minutes. Let me check with a GAMS model:

image

The first thing we notice is that GAMS takes 25 seconds to generate this model. We can improve on this a little bit by adding option limrow=0 (and to be complete limcol=0) to reduce the size of the listing file. Probably we also should turn off the solution listing (option solprint=off) to reduce time on the way back. This gives us a generation time of 19 seconds, and a solution time of 5 seconds with the open source solver CBC. The total turnaround time is 32 seconds. About a speedup of 100k.  For these super easy models we see that solving time may be less than generation time.

Interestingly Cplex takes more time than CBC: 25 seconds vs 5 seconds (both using default settings). This is because Cplex tries very hard to presolve the model (20 seconds). This is actually not a bad thing: I prefer Cplex to work hard there so the more difficult models solve faster. Loosing a bit on simple problems is not a big deal.

Saturday, December 5, 2015

Finding a specific submatrix

From: http://math.stackexchange.com/questions/1542593/binary-integer-program-with-nonlinear-function/1559874#1559874:

image

Here we mean by submatrix any set of columns (not necessarily contiguous). I can model this as a linear MIP:

image 

The results look like:

image

Notice I don’t do a max of a max here. I just let the model pick the elements that form the maximum objective. Automatically the solver will pick the maximum in each row.

Note this model only works when all entries are non-negative. If there are negative numbers things may not work anymore. But a simple preprocessing step can help. Just take the most negative value. Multiply by minus one and add to all entries of the matrix. Then apply the model.

What is a submatrix? Contiguous?

I always thought that a submatrix is a contiguous part of a matrix. Like

image

as shown in http://mathworld.wolfram.com/Submatrix.html.

However in https://en.wikipedia.org/wiki/Matrix_(mathematics)#Submatrix there is a different definition: take any number of rows and columns away and the result is a submatrix:

image 

This version will allow non-contiguous regions to be part of the submatrix.

Thursday, December 3, 2015

Optimality of a small MINLP model

When I read a paper I often try quickly to implement the example and see if I can solve it. Here is a small MINLP model related to RRAP (Reliability-Redundancy Allocation Problem).

image 

It is very similar to the approach in http://yetanothermathprogrammingconsultant.blogspot.com/2015/11/linearization-by-enumeration-of-small.html. That is we want to maximize the reliability of a system by adding redundant components subject to cost, weight and volume constraints. The special thing here is that we not only decide on the redundancy (variable n) but also choose components along a cost-reliability curve (see equation cdef). The result is a small MINLP model. In the paper a PSO (Particle Swarm Optimization) algorithm is developed to solve model. However we can also just throw this model into a MINLP solver. The results are:

image

With the MINLP solver BONMIN I get:

image

BONMIN solves this is 4 seconds with a solution that is slightly better. The integer configuration (redundancy) is the same, but the cost/reliability trade-off is slightly different.

In general I would say that meta-heuristics are more appropriate when standard off-the-shelve solvers are running out of steam. This can happen when the problem becomes too big. That is certainly not the case here. Also I think one should never mention “optimal” in connection with a result found with a (meta-)heuristic. These methods do not give any guarantee about optimality.

Reference

HARISH GARG, S. P. SHARMA
RELIABILITY–REDUNDANCY ALLOCATION PROBLEM OF PHARMACEUTICAL PLANT
Journal of Engineering Science and Technology Vol. 8, No. 2 (2013) 190 - 198

Tuesday, December 1, 2015

SQLite and Excel/VBA

In the comment section of  http://yetanothermathprogrammingconsultant.blogspot.com/2013/10/gdx2sqlite.html it is mentioned that Excel and VBA (via ODBC) has troubles with fields that are declared as TEXT. Although I have added an option to GDX2SQLITE to generate VARCHAR(255) columns I am wondering what the problem can be. Internally SQLite will use a storage type TEXT for all character types (https://www.sqlite.org/datatype3.html).

To generate a test case I just ran some GAMS models and generated a GDX file out of this: 

trnsport1

This converts easily and quickly into a SQLite database:

trnsport2

I had no troubles importing this into Excel:

image

Anyway, I have added an option –varchar to generate VARCHAR(255) types for the string columns in the CREATE TABLE statements.

Note: see also the discussion in http://sqlite.1065341.n5.nabble.com/TEXT-columns-with-Excel-VBA-td85907.html. I have come to the conclusion that the reliance on VARCHAR is probably in some user code.

Bin Packing but different

From http://cs.stackexchange.com/questions/48510/help-wrapping-my-head-around-a-combinatorial-optimization-problem/50179#50179:

Here's the problem I'm trying to solve:

I have a bunch of widgets, whose weights vary over a small range. I would like to find the optimal grouping of them such that each group meets a minimum weight requirement, while maximizing the total number of groups I can form.

My solution:

image

The order equation is interesting: it is a symmetry breaking constraint but also improves how the solution looks: start with assigning to lower numbered bins.

An even more interesting question is: do we need equation UnusedBin? If we are just interested in the maximum number of bins we can fill-up then no. But if we want to prevent some lingering widget j to be assigned to an unused bin then we should include it. I decided to include it in my answer on StackExchange as the solution is easier to interpret.

With 1000 widgets things become large and difficult.  Is is noted further that:

Let's say we have 1000 widgets, weights ranging from 2-4 oz in .05 oz increments, and the minimum weight requirement for all groups is 8 oz

Indeed one poster added that this means there are just 40 possible weights. How to exploit that is an interesting question. I probably would look at some column generation approach similar to some cutting stock examples.