Sunday, May 31, 2009

GAMS Speed

I was asked to for help in implementing a slight variation on the data input module discussed in this post. The change was to filter the input records. My first suggestion was:

* only these records will be copied to b
set subseti(*) /
    OAF_PT_NT
    OAF_PT_QC
/;

loop((s1,s2,s3,s4,s5)$(a(s1,s2,s3,s4,s5) and subseti(s1)),
  i(s1) = yes;
  j(s5) = yes;
  b(s1,s5) = a(s1,s2,s3,s4,s5);
);

This worked nicely on my small dataset but was totally disastrous on the large production data. The reason is that GAMS is suddenly reverting to “dense” processing where all possible combinations s1 × s2 × s3 × s4 × s5 are considered instead of only the ones for which parameter a() exist. If we use:

loop((s1,s2,s3,s4,s5)$a(s1,s2,s3,s4,s5),

GAMS is doing the right thing. The Cartesian product of the index sets is exceptionally bad here because they are the universe set *. With

loop((s1,s2,s3,s4,s5)$(a(s1,s2,s3,s4,s5) and subseti(s1)),

GAMS should be able to do the same optimization but fails to do so. On a small data set this is not immediately visible, but on a large data set we will see very slow performance. A simple reformulation helps here:

loop((subseti,s2,s3,s4,s5)$a(subseti,s2,s3,s4,s5),
  i(subseti) = yes;
  j(s5) = yes;
  b(subseti,s5) = a(subseti,s2,s3,s4,s5);
);

Now GAMS is fast again.

Other variations of the loop are:

loop((s1,s2,s3,s4,s5)$(a(s1,s2,s3,s4,s5) * subseti(s1)),
  i(s1) = yes;
  j(s5) = yes;
  b(s1,s5) = a(s1,s2,s3,s4,s5);
);

and

loop((s1,s2,s3,s4,s5)$(a(s1,s2,s3,s4,s5)$subseti(s1)),
  i(s1) = yes;
  j(s5) = yes;
  b(s1,s5) = a(s1,s2,s3,s4,s5);
);

These are all fast. I was successful in advising to use the slowest variant!

On the real data the timings are:

loop time
loop over all records
loop((s1,s2,s3,s4,s5)$a(s1,s2,s3,s4,s5), 37.815 SECS
loop over records in subset
loop((s1,s2,s3,s4,s5)$(a(s1,s2,s3,s4,s5) and subseti(s1)), Infinity: stopped after 10 minutes.
Client ran this for a whole night without results
loop((subseti,s2,s3,s4,s5)$a(subseti,s2,s3,s4,s5), 0.000 SECS
loop((s1,s2,s3,s4,s5)$(a(s1,s2,s3,s4,s5)*subseti(s1)), 0.296 SECS
loop((s1,s2,s3,s4,s5)$(a(s1,s2,s3,s4,s5)$subseti(s1)), 0.218 SECS

Update: this behavior is related to parameter A containing special values (it had some NA’s). Because of this the operators AND and * have different behavior (not exactly sure why).

Saturday, May 30, 2009

MS Solver Foundation Data Binding problem

This program gives an exception I don't understand:

using System;
using System.Collections.Generic;
using System.Linq;
using System.Data;
using System.Data.OleDb;
using System.Data.Linq;
using System.Text;
using Microsoft.SolverFoundation.Services;
using System.IO;

namespace
OML1
{
    class Test 
   
        /// <summary> 
        /// Called by the OS 
        /// </summary> 
        /// <param name="args"></param> 
        static void Main(string[] args) 
       
            Test t = new Test(); 
            t.Solve(); 
        }

        /// <summary> 
        /// Holds the OML model 
        /// </summary> 
        string strModel = @"Model[ 
              Parameters[Sets,I], 
              Parameters[Reals,p[I]], 

              Decisions[Reals[0,Infinity],x[I]],  

 
             Constraints[ 
                 Foreach[{i,I}, x[i]==p[i]] 
             
           ]"

        /// <summary> 
        ///  SFS 
        /// </summary> 
        SolverContext context; 

        /// <summary> 
        ///  Constructor 
        /// </summary> 
        public Test() 
       
            context = SolverContext.GetContext(); 
       

        /// <summary> 
        /// Solve the problem 
        /// </summary> 
        public void Solve() 
       
            context.LoadModel(FileFormat.OML, new StringReader(strModel)); 

            DataTable dt = new DataTable(); 
            dt.Columns.Add("index", System.Type.GetType("System.String")); 
            dt.Columns.Add("value", System.Type.GetType("System.Double")); 
            dt.Rows.Add("a", 1); 
            dt.Rows.Add("b", 2); 

 
           DataTable dt2 = new DataTable(); 
            dt2.Columns.Add("index", System.Type.GetType("System.String")); 
            dt2.Columns.Add("value", System.Type.GetType("System.Double")); 
            dt2.Rows.Add("a", -1); 
            dt2.Rows.Add("b", -1); 
 
 
           Parameter p = context.CurrentModel.Parameters.First(q => q.Name == "p"); 
            p.SetBinding(dt.AsEnumerable(), "value", new string[] { "index" }); 

            Decision x = context.CurrentModel.Decisions.First(d => d.Name == "x"); 

            // next statement gives: 
            // The property or field 'value' was not found 
>>>>>>>     x.SetBinding(dt2.AsEnumerable(), "value", new string[] { "index" }); <<<<<<<<<<<<

            Solution solution = context.Solve(); 
 
           Console.Write("{0}", solution.GetReport()); 

            context.PropagateDecisions(); 
       
   
}

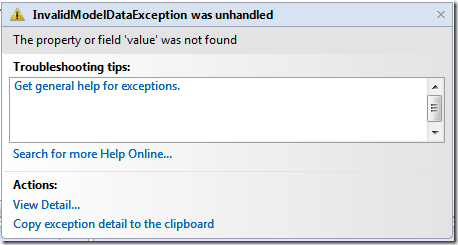
The exception is

columnNotFound

The data binding on the parameter p works fine. But the same data binding on the variable x fails. I am afraid I don’t understand this. The error message is not helping me: there is actually a column ‘value’.

I have fired off a question to this effect in the forum at http://code.msdn.microsoft.com/solverfoundation/.

Note that I easily can bind the decision to a List, and then move the data in the List to the DataTable myself.

Friday, May 29, 2009

GAMS: Skipping columns in reading a spreadsheet

I have a spreadsheet like:

dropcol

The real spreadsheet has many more rows. How do I read this into a two-dimensional GAMS parameter (dropping columns Comment, Org and Type).

There are several possibilities:

1. If you can edit the spreadsheet, just remove columns B,C,D and read data using GDXXRW

2. If you can remove the A1 cell, we can read the data as a table using XLS2GMS. XLS2GMS allows multiple-area ranges:

$call xls2gms i=test2.xls o=out.inc r=a1:a5,e1:q5

table a(*,*)
$include out.inc
;
display a;

The comma in the range is the list separator character in Excel (it may be different for different language settings). The include file will look like:

* -----------------------------------------------------
* XLS2GMS 2.8      Aug  1, 2008 22.8.1 WIN 5778.6015 VIS x86/MS Windows
* Erwin Kalvelagen, GAMS Development Corp.
* -----------------------------------------------------
* Application: Microsoft Excel
* Version:     12.0
* Workbook:    C:\projects\test\test2.xls
* Sheet:       Sheet1
* Range:       $A$1:$A$5,$E$1:$Q$5
* -----------------------------------------------------
          2006A 2007A 2008A 2009A 2010A 2011A 2012A 2013A 2014A 2015A 2016A 2017A 2018A
OAF_PT_NT -852  -831  -940  -977  -937  -869  -952  -887  -960  -945  -822  -811  -913
OAF_PT_QC 3855  3293  3418  3164  3354  3431  3690  3233  3463  3248  3679  3516  3260
OAF_PT_QP 2864  2890  2674  2891  2486  2683  2789  2873  2395  2902  2148  2119  2407
OAF_PT_ST 3     3     3     4     4     3     5     3     4     4     4     4     3
* -----------------------------------------------------

3. If you cannot change the spreadsheet at all you can ask GAMS to delete these columns. E.g. by:

$call gdxxrw i=test.xls par=a rdim=4 cdim=1 rng=a1:q5 trace=2

parameter a(*,*,*,*,*);
$gdxin test
$load a

parameter b(*,*);
set i(*);
set j(*);

alias(*,s1,s2,s3,s4,s5);

loop((s1,s2,s3,s4,s5)$a(s1,s2,s3,s4,s5),
  i(s1) = yes;
  j(s5) = yes;
  b(s1,s5) = a(s1,s2,s3,s4,s5);
);

execute_unload 'test2.gdx',i,j,b;

I.e. we read in as 4 dimensional parameter A, and then convert to 2 dimensional parameter B. The loop is optimized by using a $ condition. The following will be stored in the new GDX file:

----     25 SET i 

OAF_PT_NT,    OAF_PT_QC,    OAF_PT_QP,    OAF_PT_ST

----     25 SET j 

2006A,    2007A,    2008A,    2009A,    2010A,    2011A,    2012A,    2013A,    2014A,    2015A,    2016A,    2017A
2018A

----     25 PARAMETER b 

                2006A       2007A       2008A       2009A       2010A       2011A       2012A       2013A       2014A

OAF_PT_NT    -838.000    -838.000    -976.000    -829.000    -971.000    -996.000    -841.000    -813.000    -849.000
OAF_PT_QC    3987.000    3980.000    3081.000    3643.000    3270.000    3739.000    3512.000    3780.000    3228.000
OAF_PT_QP    2542.000    2988.000    2824.000    2503.000    2747.000    2997.000    2611.000    2348.000    2767.000
OAF_PT_ST       3.000       3.000       5.000       5.000       3.000       3.000       5.000       4.000       3.000

Adding the sets i and j will make it easier to read b with proper domains:

set i,j;
parameter b(i,j);

$gdxin test2
$load i j
$loaddc b

display i,j,b;

This (real-world) example would benefit from having some multiple-area ranges facility in GDXXRW.

Wednesday, May 27, 2009

Convert GAMS to OML

A simple way to generate scalar OML from GAMS is to use the CONVERT “dummy” solver. Use an option file convert.opt with

sfs

E.g. for the model trnsport.gms from the GAMS model library we do:

> gams trnsport lp=convert optfile=1

This will show:

--- Job trnsport.gms Start 05/27/09 17:03:47 WEX-VIS 23.0.2 x86/MS Windows       
GAMS Rev 230  Copyright (C) 1987-2009 GAMS Development. All rights reserved
Licensee: Erwin Kalvelagen                               G090213/0001CV-WIN
          Amsterdam Optimization Modeling Group                      DC4572
--- Starting compilation
--- trnsport.gms(69) 3 Mb
--- Starting execution: elapsed 0:00:00.003
--- trnsport.gms(45) 4 Mb
--- Generating LP model transport
--- trnsport.gms(66) 4 Mb
---   6 rows  7 columns  19 non-zeroes
--- Executing CONVERT: elapsed 0:00:00.009

Convert 2.0      Feb 14, 2009 23.0.2 WIN 9388.9411 VIS x86/MS Windows        

--- Using Option File
Reading parameter(s) from "C:\projects\ms\convert.opt"
>>  sfs
>>
Finished reading from "C:\projects\ms\convert.opt"
--- Writing SFS       : sfs.oml

--- Restarting execution
--- trnsport.gms(66) 0 Mb
--- Reading solution for model transport
--- Executing after solve: elapsed 0:00:00.063
--- trnsport.gms(68) 3 Mb
*** Status: Normal completion
--- Job trnsport.gms Stop 05/27/09 17:03:47 elapsed 0:00:00.083

The output will look like:

//  LP written by GAMS Convert at 05/27/09 17:03:47
//
//  Equation counts
//      Total        E        G        L        N        X        C
//          6        1        3        2        0        0        0
//
//  Variable counts
//                   x        b        i      s1s      s2s       sc       si
//      Total     cont   binary  integer     sos1     sos2    scont     sint
//          7        7        0        0        0        0        0        0
//  FX      0        0        0        0        0        0        0        0
//
//  Nonzero counts
//      Total    const       NL      DLL
//         19       19        0        0
//
//  Reformulation has removed 1 variable and 1 equation

Model[
  Decisions[Reals[0, Infinity],x1],
  Decisions[Reals[0, Infinity],x2],
  Decisions[Reals[0, Infinity],x3],
  Decisions[Reals[0, Infinity],x4],
  Decisions[Reals[0, Infinity],x5],
  Decisions[Reals[0, Infinity],x6],

Goals[ Minimize[    0.225*x1 + 0.153*x2 + 0.162*x3 + 0.225*x4 + 0.162*x5 + 0.126*x6 ]],

Constraints[

e2 ->   x1 + x2 + x3 <= 350,

e3 ->   x4 + x5 + x6 <= 600,

e4 ->   x1 + x4 >= 325,

e5 ->   x2 + x5 >= 300,

e6 ->   x3 + x6 >= 275 ]]

This format is called “scalar” model opposed to an “indexed” model. I produced by hand the following “indexed” model, which is preferable if you need to maintain the model in OML or if large amounts of data needs to be imported from data sources:

Model[
  Parameters[Sets,Plants,Markets],
  Parameters[Reals,Capacity[Plants],Demand[Markets],Cost[Plants,Markets]],

  Decisions[Reals[0,Infinity],x[Plants,Markets],TotalCost],

  Constraints[
     TotalCost == Sum[{i,Plants},{j,Markets},Cost[i,j]*x[i,j]],
     Foreach[{i,Plants}, Sum[{j,Markets},x[i,j]]<=Capacity[i]],
     Foreach[{j,Markets}, Sum[{i,Plants},x[i,j]]>=Demand[j]]
  ],

  Goals[Minimize[TotalCost]]
]

The scalar model may be especially useful for experimentation and evaluation.

Notes:

Monday, May 25, 2009

Logical conditions

> How do I model
>   if u(i,j)=0 then x(i,j)=x(i,j-1)+1 & y(i,j)=0
>   else y(i,j)=y(i,j-1)+1 & x(i,j)=0

With big-M formulations:

  • -M1*u(i,j) ≤ x(i,j) − x(i,j−1) − 1 ≤ +M1*u(i,j)
  • y(i,j) ≤ M2*u(i,j)
  • -M3*(1−u(i,j)) ≤ y(i,j)−y(i,j−1)−1 ≤ +M3*(1−u(i,j))
  • x(i,j) ≤ M4*(1−u(i,j))

The constants M1 through M4 need to be chosen with care: as small as possible but large enough that they can make the corresponding constraint non-binding. Some conservative choices would be (assuming the integer variables have a lower-bound of zero):

  • M1=x.up+1
  • M2=y.up
  • M3=y.up+1
  • M4=x.up

where x.up and y.up are the upper-bounds on x and y (chosen as tight as possible).

With Cplex indicator constraints this can be modeled even simpler, as you don’t have to worry about big-M values. GAMS has limited but quite workable support for this through an option file; AMPL has more complete support for these directly in their language which is a cleaner approach IMHO. Implications are integral part of the model, and moving them to an option file makes the model less self-contained: you have to look in different spots to understand the model. I would prefer that options are reserved to solver options (tolerances, algorithm selection etc.) instead of modeling constructs.

The argument against augmenting the language is that this is a pure Cplex-only facility (although I believe SCIP also supports indicator constraints), that cannot be translated transparently to other MIP solvers. (In the long term one would expect constraint programming with their if-then-else constructs will get more accepted either separate or integrated into MIP solvers; modeling languages will need then to manage these constructs in a consistent way. AMPL had some efforts in this direction, although I don’t think their CP facilities are general available, and MS OML already supports both paradigms.)

The above could be modeled in AMPL as:

  e1{i in I, j in I}: u[i,j]=0 ==> y[i,j]=0 else x[i,j]=0;
  e2{i in I, j in I: j>1}: u[i,j]=0 ==> x[i,j]=x[i,j−1]+1 else y[i,j]=y[i,j−1]+1;

(see also this post).

Sunday, May 24, 2009

GAMS/OQNLP listing

While trying to find a better solution for the problem described in this post, I noticed a few rough spots when using OQNLP.

The GAMS/QONLP link writes messages to the listing file with =2 attached:

Reading parameter(s) from "C:\projects\test\oqnlp.opt"=2

>>  nlpsolver conopt=2

>>  iteration_limit 10000=2

>>  max_solver_calls_noimprovement 2000=2

Finished reading from "C:\projects\test\oqnlp.opt"=2

OQMS Default Iteration Limit of 1000 OverRidden by Option File Value of 10000=2

This is largely cosmetics (including the overuse of capitals). The documentation contains some funny characters and incomprehensible sentences:

within a percentage gap of 1default parameters and options

It solved two of those three to within 1library to within 1seven remaining ones

Unfortunately quality assurance is really more than checking the return codes on test scripts. These silly errors are only caught by actually solving a model and eyeballing the results and reading the generated documentation.

Btw: no better solution was found. Using OQNLP provides a convenient and quick way to investigate if a local solution is not easily dominated by other better solutions. The model was reformulated in this post making a single solve fast enough that using OQNLP’s multi-start approach a feasible approach. The nonlinear functions were too complex for Baron: it had problems even getting started (this was to be expected).

NLP model reformulation

With MIP models we know that it is important to try out different formulations. A good formulation can make the difference between being able to solve a model is reasonable time or not. For NLP models this is also the case. A client model (non-convex NLP) was solved with GAMS/CONOPT with the following results:

equations : 35,347
variables : 35,721
nonzeroes : 141,753 (of which 106,032 nonlinear)

objective : 8021923.97 (local optimum, minimization)
time : 2366.7 seconds

After reformulating the model the results were:

equations : 3
variables : 377
nonzeroes : 753 (of which 376 nonlinear)

objective : 7714519.00 (local optimum, minimization)
time : 0.4 seconds

The main effort was in substituting out some variables, causing the problem to become linearly constrained and much smaller. The objective became not just a little bit but awfully nonlinear, but the trade-off was clear.

Saturday, May 23, 2009

Domain error with log

> When I run my GAMS model I get
> *** Error at line 36749: log: FUNC SINGULAR: x = 0
> How can I fix this?

This means that you have a function log(x) in your model (see line 36749 in the listing file), where x assumes the value x=0.

There are several ways to fix this.

  1. Apply a bound X.LO=0.0001;. Of course if you have LOG(EXPRESSION) then this is a little bit more complicated. In that case you need to introduce a new variable Y, and an equation Y =E= EXPRESSION; after which you can add Y.LO=0.0001 and use LOG(Y). The NLP solvers under GAMS will never evaluate a nonlinear function with the arguments outside their bounds. Note that adding a bound also changes the default initial point. Usually the default initial point is zero, but when there are bounds the default initial point becomes the closest bound from zero.
  2. If it is just an intermediate point during the solve you can as a short-cut increase the DOMLIM option to allow a few domain errors. The initial point must be valid, otherwise GAMS will not start the solver (this can be fixed by a better initial point). In general I use this if option 1 is too complicated to implement quickly or if the addition of extra variables and equations makes the model (much) more difficult.
  3. If you have POSITIVE VARIABLE X, then LOG(X+0.0001) is quick way to bypass the problem. The advantage of this formulation is that we still allow X=0 which may improve the readability of the solution reports.

Note that solvers may allow variables to be slightly outside their bounds due to different feasibility tolerances. The suggested value 0.0001 is sufficiently large not to be bothered by this.

Friday, May 22, 2009

Oligopolistic producer behavior

> You had a note on how to model oligopolistic producer behavior in GAMS?

Uploaded to http://www.amsterdamoptimization.com/pdf/oligopoly.pdf.

The paper shows that an MCP formulation is natural for this. It also compares prices and quantities with the situation where the firms are merged and a large monopolist is formed. This behavior is easily modeled using a simple NLP model. A numerical experiment like this can be quickly implemented using a modeling language.

Thursday, May 21, 2009

Excel and statistics

I am using Excel 2007 a lot for data entry and reporting. So I was wondering about an old bug wrt the GAMMADIST function I stumbled upon when I wanted to compare my implementation of the Incomplete Gamma function with Excel. Well,

=+GAMMADIST(0.1,0.1,1,TRUE)

still produces #NUM!. This particular bug is known here.

There are other reports about accuracy issues with older versions of Excel, see e.g.:

There have been improvements in Excel XP/2003, but some issues remained:

In case you want to know the answer for the above formula, let’s use my implementation from GAMS:

1  scalar s;
2  s = gammareg(0.1/1,0.1);
3  option s:8;
4  display s;

----      4 PARAMETER s                    =   0.82755176 

I don’t think this is a particularly difficult point to evaluate. Nothing strange going on here. So I don’t understand why Excel has problems here.

Tuesday, May 19, 2009

Paper on Xpress

I was asked to announce a paper on the Xpress solver:

Richard Laundy, Michael Perregaard, Gabriel Tavares, Horia Tipi, Alkis Vazacopoulos
Solving Hard Mixed-Integer Programming Problems with Xpress-MP: A MIPLIB 2003 Case Study
INFORMS Journal on Computing
Vol. 21, No. 2, Spring 2009, pp. 304–313

Xpress was recently acquired by Fair Isaac. I believe that for users of Xpress not much has changed as a result of this (may be their spelling of optimise will change, although it would be nice to have a recognizable British optimiser around.). The paper discusses some impressive progress on some notorious difficult MIP problems.

Note that the results are from three years ago! These type of performance review papers are usually already outdated before they  are actually printed; may be a printed scientific journal is not the optimal venue for a paper like this.

Monday, May 18, 2009

Gurobi Standalone version available

The Gurobi standalone solver is now available. More information is available on the website www.gurobi.com. There is reference material online to peruse. I have some experience with using Gurobi, and although I have not done any formal benchmarks, on my models it has shown to be very competitive with the other leading LP/MIP solvers and remarkably stable. Gurobi seems especially attractive when you have a machine with many cores/cpu’s available (and soon we all have cell-phones with 16 cores).

Interestingly the shell is based on Python. I am probably one of the very few ones who remember ABC, a small language developed at the CWI that was in many respects the origin of Python.

CSP: indexing by a variable

A table lookup construct y=value[x] where x is an integer variable can be implemented in a MIP model as follows:

Parameters[Sets[Integers],I],
Parameters[Reals,value[I]],
Decisions[Integers[0,1],b[I]],
Constraints[
    Sum[{i,I},b[i]]==1,
    x == Sum[{i,I},i*b[i]],
    y == Sum[{i,I},value[i]*b[i]],
    ....

Here x and y are variables (they can be relaxed to be continuous as they are automatically integer – that is depending on value[] for y). Some experienced MIP users may recognize a SOS1 structure here. In a CSP model this can sometimes be expressed more succinctly as:

y == value[x]

This is also (and more coherently) discussed in the AMPL extensions document: http://www.ampl.com/NEW/FUTURE/logic.html#varsub. More info here: http://users.iems.northwestern.edu/~4er/WRITINGS/extmodcp.pdf. These references contain some motivating examples.

The Microsoft Solver Foundation group will add this to their OML language: http://code.msdn.microsoft.com/solverfoundation/Thread/View.aspx?ThreadId=1739. This will allow for very natural and intuitive formulations for some models.

Sunday, May 17, 2009

One-liner optimization problems

As long as your problem fits on one line, Wolfram’s Alpha engine may be able to solve it:  http://www.wolframalpha.com/input/?i=optimization+examples. Not sure if we can solve any larger problems with this.

Wednesday, May 13, 2009

Probit estimation with GAMS

Here is an example how to do probit estimation with GAMS. We use the dataset Table F21.1 from Greene. We estimate by forming a likelihood function which we can maximize using a standard NLP solver. First we do OLS to get a good starting point for the NLP. The OLS estimation is done through the specialized LS solver.

The reason to use a specialized least squares solver is twofold: (1) it is not easy to do least squares reliably using standard (linear) optimization tools. The normal equations allow for using an LP but in forming the normal equations you may create numerical difficulties. Of course one could solve a QP. (2) Some of the statistics useful in reporting OLS results are not trivial to compute in GAMS. A specialized solver can solve LS problems quickly and reliably with linear technology and in additional produce all kind of statistics useful in assessing the quality of the fit.

The max likelihood estimation problem is to maximize:

image

Here y is the dependent (binary) variable, and x are the independent variables (note: the variables are data in the optimization problem). β is the vector of coefficients to estimate (these are the decision variables in the optimization problem). Φ is the CDF of the standard normal distribution. This expression is reformulated into:

image

$ontext

Probit Estimation
We use OLS to get a good starting point

Erwin Kalvelagen, Amsterdam Optimization, 2009

Data:
http://pages.stern.nyu.edu/~wgreene/Text/tables/TableF21-1.txt

$offtext

set i /1*32/;

table data(i,*)

GPA TUCE PSI GRADE
1 2.66 20 0 0
2 2.89 22 0 0
3 3.28 24 0 0
4 2.92 12 0 0
5 4.00 21 0 1
6 2.86 17 0 0
7 2.76 17 0 0
8 2.87 21 0 0
9 3.03 25 0 0
10 3.92 29 0 1
11 2.63 20 0 0
12 3.32 23 0 0
13 3.57 23 0 0
14 3.26 25 0 1
15 3.53 26 0 0
16 2.74 19 0 0
17 2.75 25 0 0
18 2.83 19 0 0
19 3.12 23 1 0
20 3.16 25 1 1
21 2.06 22 1 0
22 3.62 28 1 1
23 2.89 14 1 0
24 3.51 26 1 0
25 3.54 24 1 1
26 2.83 27 1 1
27 3.39 17 1 1
28 2.67 24 1 0
29 3.65 21 1 1
30 4.00 23 1 1
31 3.10 21 1 0
32 2.39 19 1 1

;

set k 'independent variables' /constant,gpa,tuce,psi/;

parameters
y(i) 'grade'
x(k,i) 'independent variables'
;

y(i) = data(i,'grade');
x('constant',i) = 1;
x(k,i)$(not sameas(k,'constant')) = data(i,k);

parameter estimate(k,*);

*-----------------------------------------------------------
* O L S
*-----------------------------------------------------------

variable sse,coeff(k);
equation obj,fit(i);

obj.. sse =n= 0;
fit(i).. y(i) =e= sum(k, coeff(k)*x(k,i));

model ols /obj,fit/;
option lp=ls;
solve ols using lp minimizing sse;

estimate(k,'OLS') = coeff.l(k);

*-----------------------------------------------------------
* P R O B I T
*-----------------------------------------------------------

variable logl;
equation like;

like.. logl =e= sum(i$(y(i)=1), log(errorf(sum(k,coeff(k)*x(k,i)))))
+sum(i$(y(i)=0), log(1-errorf(sum(k,coeff(k)*x(k,i)))));

model mle /like/;
solve mle using nlp maximizing logl;

estimate(k,'Probit') = coeff.l(k);

display estimate;


The results are identical to the numbers published in Greene.


----     99 PARAMETER estimate

 
                 OLS      Probit


GPA            0.464       1.626
TUCE           0.010       0.052
PSI            0.379       1.426
constant      -1.498      -7.452

This model looks much simpler than what is discussed here.

Updated the LS solver docs to include this example.

Monday, May 11, 2009

MS OML model using C# and data from Access

Looking at http://code.msdn.microsoft.com/solverfoundation/Thread/List.aspx it is noticeable that many users have problems coding simple problems in C#. One possible reason is that they use C# to assemble the model. Although not extremely difficult, it is gives very unwieldy models: the signal-to-noise ratio in the code is small as you need lots of syntactic clutter just to specify all variables and constraints compared to a specialized modeling language. Large models can easily have dozens of blocks of variables and equations. In this post I want to emphasize an alternative that is somewhat underrated: it is possible to use OML directly in your C# application. That will immediately make the model much more compact and readable.

The second issue is that the data-binding is often not completely straightforward. Many questions are related to data binding. Below is the simplest solution I could come up with for the following architecture: the math programming model is a simple transportation model and all data is stored in an Access database. The goal is to provide a skeleton example that is both readable and simple while being useful as a starting point for larger, more complex applications. The advanced features of LINQ as used throughout the Solver Foundation documentation are largely geared towards SQL Server. Therefore I wanted to explore how a simpler database like Access could be handled. If Access is working, there is good reason to believe that any other major database will also work, as we are working with the lowest common denominator in some respects. Many databases are accessible through OleDb. In practice it may be a problem that all data has to come from the database: OML has no facilities for data manipulation. Large models often have large amount of data, which may need some form of processing (aggregation etc.). Even if your real database is say Oracle, it may be useful to use Access as front-end tool to perform these data manipulation steps.

The model is the trnsport.gms model from the GAMS model library. It is small and has a few small parameters. For more info see http://www.amsterdamoptimization.com/models/msf/oml.pdf. In OML the model looks like:

Model[
  Parameters[Sets,Plants,Markets],
  Parameters[Reals,Capacity[Plants],Demand[Markets],Cost[Plants,Markets]],

  Decisions[Reals[0,Infinity],x[Plants,Markets],TotalCost],

  Constraints[
     TotalCost == Sum[{i,Plants},{j,Markets},Cost[i,j]*x[i,j]],
     Foreach[{i,Plants}, Sum[{j,Markets},x[i,j]]<=Capacity[i]],
     Foreach[{j,Markets}, Sum[{i,Plants},x[i,j]]>=Demand[j]]
  ],

  Goals[Minimize[TotalCost]]
]

In C# we can do:

/// <summary>
/// Holds the OML model
/// </summary>
string strModel = @"Model[
      Parameters[Sets,Plants,Markets],
      Parameters[Reals,Capacity[Plants],Demand[Markets],Cost[Plants,Markets]],

      Decisions[Reals[0,Infinity],x[Plants,Markets],TotalCost],

      Constraints[
         TotalCost == Sum[{i,Plants},{j,Markets},Cost[i,j]*x[i,j]],
         Foreach[{i,Plants}, Sum[{j,Markets},x[i,j]]<=Capacity[i]],
         Foreach[{j,Markets}, Sum[{i,Plants},x[i,j]]>=Demand[j]]
      ],

      Goals[Minimize[TotalCost]]
   ]";

followed by:

SolverContext context;
context.LoadModel(FileFormat.OML, new StringReader(strModel));
Solution solution = context.Solve();
Console.Write("{0}", solution.GetReport());

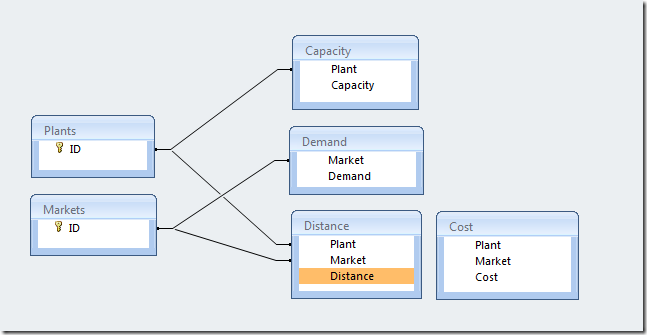
This was easy and as short as can be. Now we need to get the data. The database is organized as:

image

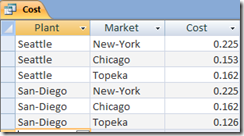
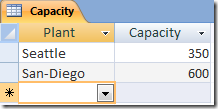
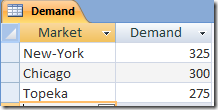
We will use the tables Capacity and Demand and the Query Cost.  The data looks like:

image image image

To bind the data we use the following code:

/// <summary>
/// Solve the problem
/// </summary>
public void Solve()
{
    context.LoadModel(FileFormat.OML, new StringReader(strModel));

    foreach (Parameter p in context.CurrentModel.Parameters)
    {
        switch (p.Name)
        {
            case "Capacity":
                setBinding(p,"select plant,capacity from capacity",
                    "capacity", new string[]{"plant"});
                break;
            case "Demand":
                setBinding(p,"select market,demand from demand",
                    "demand", new string[]{"market"});
                break;
            case "Cost":
                setBinding(p,"select plant,market,cost from cost",
                    "cost", new string[]{"plant", "market"});
                break;
        }

    }

    Solution solution = context.Solve();
    Console.Write("{0}", solution.GetReport());

}

In each binding operation we specify:

  1. The SFS parameter, which we retrieve from the CurrentModel
  2. The query to be used against the database
  3. The name of the data column
  4. The names of the index columns (passed on as an array of strings)

The complete model looks like:

using System;
using System.Collections.Generic;
using System.Linq;
using System.Data;
using System.Data.OleDb;
using System.Data.Linq;
using System.Text;
using Microsoft.SolverFoundation.Services;
using System.IO;

namespace OML1
{
class Trnsport
{
/// <summary>
/// Called by the OS
/// </summary>
/// <param name="args"></param>
static void Main(string[] args)
{
Trnsport t = new Trnsport();
t.Solve();
}

/// <summary>
/// Holds the OML model
/// </summary>
string strModel = @"Model[
Parameters[Sets,Plants,Markets],
Parameters[Reals,Capacity[Plants],Demand[Markets],Cost[Plants,Markets]],

Decisions[Reals[0,Infinity],x[Plants,Markets],TotalCost],

Constraints[
TotalCost == Sum[{i,Plants},{j,Markets},Cost[i,j]*x[i,j]],
Foreach[{i,Plants}, Sum[{j,Markets},x[i,j]]<=Capacity[i]],
Foreach[{j,Markets}, Sum[{i,Plants},x[i,j]]>=Demand[j]]
],

Goals[Minimize[TotalCost]]
]";

/// <summary>
/// Connection string for MS Access
/// Use x86 architecture!
/// </summary>
string connection = @"Provider=Microsoft.ACE.OLEDB.12.0;Data Source=C:\projects\ms\OML1\OML1\trnsport.accdb;Persist Security Info=False;";

/// <summary>
/// SFS
/// </summary>
SolverContext context;

/// <summary>
/// Constructor
/// </summary>
public Trnsport()
{
context = SolverContext.GetContext();
}

/// <summary>
/// get query result as DataSet
/// </summary>
/// <param name="connection">connection string</param>
/// <param name="query">query as string</param>
/// <returns></returns>
private DataSet SelectOleDbSrvRows(string connection, string query)
{
DataSet ds = new DataSet();
OleDbConnection conn = new OleDbConnection(connection);
OleDbDataAdapter adapter = new OleDbDataAdapter();
adapter.SelectCommand = new OleDbCommand(query, conn);
adapter.Fill(ds);
return ds;
}

/// <summary>
/// Perform some magic to make sure the query output arrives in OML model.
/// </summary>
/// <param name="p">OML/SFS parameter</param>
/// <param name="query">database query</param>
/// <param name="valueColumn">column with values</param>
/// <param name="IndexColumns">columns with indices</param>
private void setBinding(Parameter p, string query, string valueColumn, string[] IndexColumns)
{
DataSet ds = SelectOleDbSrvRows(connection, query);
DataTable dt = ds.Tables[0];
p.SetBinding(dt.AsEnumerable(), valueColumn, IndexColumns);
}

/// <summary>
/// Solve the problem
/// </summary>
public void Solve()
{
context.LoadModel(FileFormat.OML, new StringReader(strModel));

foreach (Parameter p in context.CurrentModel.Parameters)
{
switch (p.Name)
{
case "Capacity":
setBinding(p,"select plant,capacity from capacity",
"capacity",new string[]{"plant"});
break;
case "Demand":
setBinding(p,"select market,demand from demand",
"demand", new string[]{"market"});
break;
case "Cost":
setBinding(p,"select plant,market,cost from cost",
"cost", new string[]{"plant", "market"});
break;

}

}

Solution solution = context.Solve();
Console.Write("{0}", solution.GetReport());

}

}
}

Some notes:

  • This should work with almost any database. Just change the connection string accordingly.

  • MS Access drivers are 32 bit so make sure you compile as 32 bit application. When targeting a 64 bit environment I got an exception about not being able to find an appropriate driver.

  • The contents of the sets are derived from the parameter bindings: set elements are the union of the set elements used in the parameter binding.

  • It may be useful to test the model beforehand using the Excel plug-in.

  • Should use only one connection: make OleDbConnection conn a field of the object.

  • How to write results back? This is often more complicated.

Saturday, May 9, 2009

MS .NET Chart: how to turn point labels on/off

There is no property to turn on or off the visibility of data point labels (i.e. something called enabled or so). The following trick works: make the color transparent if you don’t want to see the labels. Here is some code that works for me:

        private void FlipLabels(Series s)
{
if (s.LabelForeColor == System.Drawing.Color.Transparent)
{
s.LabelForeColor = System.Drawing.Color.Black;
s.SmartLabelStyle.CalloutLineColor = System.Drawing.Color.Black;
}
else
{
s.LabelForeColor = System.Drawing.Color.Transparent;
s.SmartLabelStyle.CalloutLineColor = System.Drawing.Color.Transparent;
}
}


See also: http://social.msdn.microsoft.com/Forums/en-US/MSWinWebChart/threads/


Update: too bad I can not change the line style to arrows in a line chart. See: http://social.msdn.microsoft.com/Forums/en-US/MSWinWebChart/thread/01b61a40-203d-45dd-8834-7e8f49b974c7/.

Modeling posts today

Hi,
For a project I'm working on, I need to solve the following problem. Suppose
we have a squared-grid (size=n) with n^2 cells with a 4-connexity
neighborhood. Each cell must contains exactly one building. We have several
building colors (blue, red and green) with an increasing amount of points.
The game rules are the following:
* No constraints on blue buildings.
* Red buildings must have at least one blue building in its neighborhood.
* Green buildings must have at least one red building and at least one blue
building in its neighborhood.
The goal is to maximize the number of points by having the biggest buildings
(green > red > blue). I have started to write the LP but I have some
difficulties to express the constraint on red buildings because it directly
depends on the values of the variables. So, I would like to transform the
following constraint

param n, integer, > 0, default 4;
var x{1..n, 1..n}, integer, >=0, <=2; /*blue=0, red=1 and green=2 */

s.t. r{i in 1..n, j in 1..n:x[i,j]=1}: sum{a in i-1..i+1, b in j-1..j+1:a>=1
and a<=n and b>=1 and b<=n and i!=a and b!=j and x[a,b]=0} x[i,j] >= 1;

into a valid one. I think there's a way to express it by using binary
variables but I don't see how. Does anybody can help me ? Thanks in advance
for your help.

Indeed you can not use a variable to drive sets (basically the sets are handled by the modeling system and the variables by the solver, so there is a phase difference; another way to look at it is that the solver expects a system of purely linear inequalities). It is better to use a binary variable with an extra index for the color. That makes implementing the logical condition much easier. The model is simple once you decided on how the variables are organized. Here is the model:

set C; # colors
param n;
set I := 1..n;
param points{C};

set neighbor{i in I, j in I} := setof{i1 in max(i-1,1)..min(i+1,n),j1 in max(j-1,1)..min(j+1,n)}(i1,j1);

var x{I,I,C} binary;

maximize obj:
   sum{i in I, j in I, c in C} points[c]*x[i,j,c];
OneColor{i in I, j in I}:
   sum{c in C} x[i,j,c] = 1;

RedRequirement{i in I, j in I}:
   sum{(i1,j1) in neighbor[i,j]} x[i1,j1,'blue'] >= x[i,j,'red'];
GreenRequirement1{i in I, j in I}:
   sum{(i1,j1) in neighbor[i,j]} x[i1,j1,'red'] >= x[i,j,'green'];
GreenRequirement2{i in I, j in I}:
   sum{(i1,j1) in neighbor[i,j]} x[i1,j1,'blue'] >= x[i,j,'green'];
solve;

for{i in I}
{
   for{j in I}
   {
     printf if x[i,j,'red']>0.5 then 'R '
            else if x[i,j,'green']>0.5 then 'G '
            else if x[i,j,'blue']>0.5 then 'B ';
    }
    printf "\n";          
}

data;
set C := red green blue;
param n := 5;
param points := green 10, red 5, blue 2;
end;

This gives:

Reading model section from colors.mod...
Reading data section from colors.mod...
48 lines were read
Generating obj...
Generating OneColor...
Generating RedRequirement...
Generating GreenRequirement1...
Generating GreenRequirement2...
Model has been successfully generated
ipp_basic_tech:  1 row(s) and 0 column(s) removed
ipp_reduce_bnds: 1 pass(es) made, 0 bound(s) reduced
ipp_basic_tech:  0 row(s) and 0 column(s) removed
ipp_reduce_coef: 1 pass(es) made, 0 coefficient(s) reduced
glp_intopt: presolved MIP has 100 rows, 75 columns, 657 non-zeros
glp_intopt: 75 integer columns, all of which are binary
Scaling...
A: min|aij| = 1.000e+000  max|aij| = 1.000e+000  ratio = 1.000e+000
Problem data seem to be well scaled
Crashing...
Size of triangular part = 100
Solving LP relaxation...
      0: obj =  2.500000000e+002  infeas = 5.000e+001 (0)
*    54: obj =  2.060000000e+002  infeas = 0.000e+000 (0)
*    78: obj =  2.110000000e+002  infeas = 2.029e-015 (0)
OPTIMAL SOLUTION FOUND
Integer optimization begins...
Gomory's cuts enabled
MIR cuts enabled
Cover cuts enabled
Clique cuts enabled
Creating the conflict graph...
The conflict graph has 2*75 vertices and 150 edges
+    78: mip =     not found yet <=              +inf        (1; 0)
+   352: >>>>>  1.930000000e+002 <=  2.070000000e+002   7.3% (13; 0)
+   909: >>>>>  1.980000000e+002 <=  2.060000000e+002   4.0% (30; 8)
+  6635: mip =  1.980000000e+002 <=     tree is empty   0.0% (0; 211)
INTEGER OPTIMAL SOLUTION FOUND
Time used:   1.0 secs
Memory used: 0.8 Mb (855246 bytes)
G G G G G
B R G B R
G G G G G
G B G G G
R G G R B
Model has been successfully processed

Someone else suggested to use:

# binaries indicating color;
var is_blue{i in N, j in N}, binary;
var is_green{i in N, j in N}, binary;
var is_red{i in N, j in N}, binary;


# color counts
var blues;
var greens;
var reds;

I don't think this results in a very clean model (invalid link:thread has been removed). If you have similar variables that behave in the same way, in general it is better to add an index position so the variables can be folded into one larger structure. We can even take this approach one step further: instead of three similar constraints we can use a single constraint block using an additional set describing the implications. Note that the suggested model here (invalid link:thread has been removed) gives a different solution than my model (even after changing the objective to make the points identical) because the border is handled differently from what the poster proposed.

Update: the set neighbor should be rewritten as:

set neighbor{i in I, j in I} := setof{i1 in max(i-1,1)..min(i+1,n),j1 in max(j-1,1)..min(j+1,n): i1!=i and j1!=j}(i1,j1);
display neighbor;

to reflect what the poster indicated (see the comments).

The other post that caught my eye was this one:

Hi Everyone,

I am looking for some help with the following problem:

Let's say I have a number of print jobs (tax statements, bills etc.)

Each print job has 1 basestock and up to 6 brochures.

e.g. A tax statement prints on blue basestock and has 2 brochures (My Tax and Tax Breaks for Pensioners)

The machines that the print jobs run on have 6 hoppers for brochures and 2 trays for basestock.

I can combine the print jobs into sets, thus minimising the set up time for the machine.

e.g. If I combine 3 jobs into 1 batch, then when I run this batch on the machine I only need to to one setup.

The problem seems to be, to find the minimum number of collections that the sets can be grouped into.

e.g. I have the following print jobs:
Job 1:
Basestock A, Brochures 1, 2, 3, 4

Job 2:
Basestock B, Brochures 2,3

Job 3:
Basestock A, Brochures 5,6,7

I can combine Jobs 2 and 3, becuase this gives me a batch with 2 basestocks and 6 brochures which is within the capabilities of the machine.

So I am left with two batches:
Batch 1: Job 1

Batch 2: Jobs 2 and 3

I am looking for an algorithm that will provide the smallest number of
collections

Any assistance would be much appreciated

I don’t think the description or my understanding of it is completely correct. E.g. I think job 2 + job 3 leads to a batch of 5 brochures instead of 6. If we combine jobs 1 and 2 we use brochures 2,3 in for both jobs. I assume this is ok, and that it actually saves a spot for brochures. The advice was given to use a MIP model (this is actually not a bad idea at all), but the suggested model is not that good:

Perhaps you can make a ILP model to solve it. Suppose you have n jobs,you can define binary variable x[i,j] (1 <= i <= n,1 <= j <= n)  to show if the job i and the job j are in the same batch, As jobs are given,you can get a parameter c[i,j] to show if the job i and the job j can be in the same batch (for your example, c[2,3]=1 ,c[1,2]=0).Then
you set up such constraints:

x[i,j]=1 (i!=j) means that job i and job j are in the same batch
x[i,j]=1 (i==j)means that job i are put in the batch solely

for any  i: sum( x[i,j])=1 1 <= j <= n
for any i,j :x[i,j]=x[j,i]
for any  i: if c[i,j]==0 then x[i,j]=0  1 <= j <= n

Last,you set up the object:

min = sum( x[i,j]) 1 <= i <= n, i <= j <= n

This does not look right. First you need probably something like a binary variable x[i,k] indicating whether job i goes into batch k.  Then the rest of the model should follow. Assuming I interpret the problem correctly, the model could look like

set BROCHURES; 
set BASESTOCK;
set JOBS; 
set BATCHES; 

set Brochures{JOBS};
set BaseStock{JOBS};

param numHoppers;
param numTrays;

var x{JOBS,BATCHES} binary;
var batchUse{BATCHES} >= 0, <= 1;
var batchBrochure{BATCHES,BROCHURES} >= 0, <= 1;
var batchBaseStock{BATCHES,BASESTOCK} >= 0, <= 1;

minimize obj: sum{k in BATCHES} batchUse[k];
batchUsage{i in JOBS, k in BATCHES}: x[i,k] <= batchUse[k];
allJobs{i in JOBS}: sum{k in BATCHES} x[i,k] = 1;
calcBatchBrochures{k in BATCHES,b in BROCHURES,i in JOBS:b in Brochures[i]}:
    batchBrochure[k,b] >= x[i,k];
brochureCapacity{k in BATCHES}: sum{b in BROCHURES} batchBrochure[k,b] <= numHoppers;
calcBatchBaseStock{k in BATCHES,b in BASESTOCK,i in JOBS:b in BaseStock[i]}:
    batchBaseStock[k,b] >= x[i,k];
baseStockCapacity{k in BATCHES}: sum{b in BASESTOCK} batchBaseStock[k,b] <= numTrays;

solve;
display x;

data;
set BROCHURES := 1 2 3 4 5 6 7;
set BASESTOCK := A B;
set JOBS := job1 job2 job3;
set BATCHES := batch1 batch2 batch3;
set Brochures['job1'] := 1 2 3 4;
set Brochures['job2'] := 2 3;
set Brochures['job3'] := 5 6 7;
set BaseStock['job1'] := A;
set BaseStock['job2'] := B;
set BaseStock['job3'] := A;
param numHoppers := 6;
param numTrays := 2;
end;

I am a little bit careful here in exploiting that some variable are automatically integer when they become binding. So we only need to keep x as binary. These relaxed variables (batchUse, batchBrochure, batchBaseStock) can be considered as bounds, and they are free to move when not binding. In the case of batchUse the objective will drive the variable down to zero.  In the case of batchBrochure, batchBaseStock we don’t really care about their precise value, as long as they fulfill their role in making sure the capacity is not exceeded. Putting it differently, the calcBatchBrochures and calcBatchBaseStock inequalities implement the logical condition:

if x[i,k]=1 then batchBrochure[k,b]=1 else leave batchBrochure[k,b] unrestricted
if x[i,k]=1 then batchBaseStock[k,b]=1 else leave batchBaseStock[k,b] unrestricted 

When batchBrochure[k,b], batchBaseStock[k,b] are left floating, the capacity constraints brochureCapacity and baseStockCapacity may or may not force them to zero. So at the end of the solve, some of the values of batchBrochure[k,b], batchBaseStock[k,b] may be not equal to zero while there is no usage. The only thing you can rely on, is that if there is usage of  brochures or base stock these value will be one (the reverse will not hold in general).

It is not known how large the BATCH set should be in advance. In this case we could have used just 2 elements. An upper bound on the number of elements needed can be established by allowing as many batches as there are jobs. The result from this model will look like:

Reading model section from print.mod...
Reading data section from print.mod...
44 lines were read
Generating obj...
Generating batchUsage...
Generating allJobs...
Generating calcBatchBrochures...
Generating brochureCapacity...
Generating calcBatchBaseStock...
Generating baseStockCapacity...
Model has been successfully generated
ipp_basic_tech:  4 row(s) and 0 column(s) removed
ipp_reduce_bnds: 1 pass(es) made, 0 bound(s) reduced
ipp_basic_tech:  0 row(s) and 0 column(s) removed
ipp_reduce_coef: 1 pass(es) made, 0 coefficient(s) reduced
glp_intopt: presolved MIP has 51 rows, 39 columns, 120 non-zeros
glp_intopt: 9 integer columns, all of which are binary
Scaling...
A: min|aij| = 1.000e+000  max|aij| = 1.000e+000  ratio = 1.000e+000
Problem data seem to be well scaled
Crashing...
Size of triangular part = 51
Solving LP relaxation...
      0: obj =  0.000000000e+000  infeas = 1.400e+001 (0)
*    25: obj =  1.000000000e+000  infeas = 0.000e+000 (0)
*    30: obj =  1.000000000e+000  infeas = 0.000e+000 (0)
OPTIMAL SOLUTION FOUND
Integer optimization begins...
Gomory's cuts enabled
MIR cuts enabled
Cover cuts enabled
Clique cuts enabled
Creating the conflict graph...
The conflict graph has 2*9 vertices and 18 edges
+    30: mip =     not found yet >=              -inf        (1; 0)
+   105: >>>>>  2.000000000e+000 >=  1.333333333e+000  33.3% (4; 0)
+   120: mip =  2.000000000e+000 >=     tree is empty   0.0% (0; 7)
INTEGER OPTIMAL SOLUTION FOUND
Time used:   0.0 secs
Memory used: 0.2 Mb (239814 bytes)
Display statement at line 29
x[job1,batch1] = 1
x[job1,batch2] = 0
x[job1,batch3] = 0
x[job2,batch1] = 0
x[job2,batch2] = 1
x[job2,batch3] = 0
x[job3,batch1] = 0
x[job3,batch2] = 1
x[job3,batch3] = 0
Model has been successfully processed

These post illustrate that good modeling is difficult. It requires paying attention to details as well as keeping an eye on the model as a whole. In that sense it is often more difficult than programming where often once break down difficult tasks into more manageable pieces.