Thursday, October 4, 2012

Large nonlinear model

GAMS users build large GAMS models! Here is an example of a global trade model I am helping to build. I ran it for 5 years in one swoop:

equations 627,235
variables 662,290
generation time 6 seconds
solution time 3856 seconds
total time 1:04 (hh:mm)

We can also run it year by year:

equations period 1 125,435
variables period 1 132,458
generation time period 1 1.3 seconds
solution time period 1 2 seconds
solution time period 2 59 seconds
solution time period 3 119 seconds
solution time period 4 102 seconds
solution time period 5 20 seconds
total time 0:05 (hh:mm)

This way is much faster.

This is an example where we benefit that the modeling language supports constructs like loops etc.

Some Random Notes

image

Wednesday, September 26, 2012

Linearization

In http://yetanothermathprogrammingconsultant.blogspot.com/2012/09/bi-criteria-optimization.html I discussed an algorithm to trace the efficient frontier. We solve a number of non-convex MINLP’s for this. It is fairly easy to linearize the quadratic function by observing that the zk's only assume discrete values 0,1,..,cp.I used something like:

image 

The MIP formulation seems to perform a little bit better even though the model size (in terms of variables and equations) increases significantly:

image

Note: the size of the problems increases for each new non-dominated point. We give here the smallest (i.e. first) problem size and the largest (i.e. last) one. 

Monday, September 24, 2012

Bi-criteria optimization

In the following paper http://nvlpubs.nist.gov/nistpubs/jres/111/2/V111.N02.A05.pdf a two objective model is developed. The usual way I see such models implemented is by adding weights in some linear fashion, e.g.:

image

Here a somewhat unusual form is used:

image

Indeed when β=0 we get a single objective scheduling problem:

image

Here the slack zk in bin k is maximized using a quadratic objective. This is not a trivial problem to solve in itself as the problem is non-convex and we need a global solver. The authors use Lingo but other suitable solvers are Baron and GloMiQo. (Looking at the data – all integer – it should not be too difficult to linearize this at the expense of extra binary variables).

When we look at the 2-objective problem formulation we can observe this can be written as:

image

When β is fixed the last term is constant, so we are left with:

image

Note that the paper want to maximize the slacks zk, but minimize the start time xi,ktk. I did not immediately understand how this objective can actually work. The more direct approach I would use is:

image

or may be:

image

Actually what is proposed in the paper is quite clever. Observe that minimizing the tksixi,k's is equivalent to maximizing tkzk (as the z is a slack indicating unused capacity).

The paper indicates it finds three different solutions. They probably use a scheme trying beta=0,0.01,0.02,.., or may be some bisection. There is a much better approach where we solve a single problem for each non-dominated point (plus one problem to detect there are no more such points). Using the separable formulation with:

image

we can add some equations that allow us to trace the efficient frontier. This actually gives us 4 non-dominated solutions:

image

The second solution was not found in the paper.

For a second data set the paper reports 8 different solutions. My model generates 18 non-dominated solutions:

image

My conclusion: although the proposed formulation is quite clever, a more traditional formulation allows us to better trace the efficient frontier.

Friday, September 21, 2012

Browser compatibility

I am a bit surprised that now browsers are around for so long, that we still see incompatibilities w.r.t. JavaScript and HTML/DOM. I had some code that worked fine for IE and Chrome. Turns out Firefox did not work. Here is the reason: http://stackoverflow.com/questions/1359469/innertext-works-in-ie-but-not-in-firefox.

I used the fix from http://blog.coderlab.us/2006/04/18/the-textcontent-and-innertext-properties/.

Wednesday, September 12, 2012

Preemptive jobs

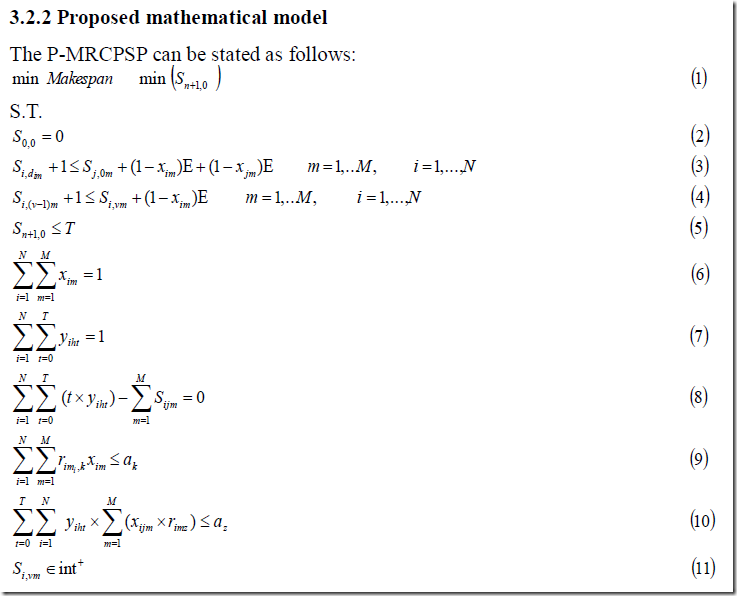
When doing some background research on a scheduling problem I was looking at the paper http://www.ijbssnet.com/journals/Vol_3_No_4_Special_Issue_February_2012/15.pdf. The model formulation is:

image

image

image

The first minor issue is notational. I suspect si,lm should really be variable with three indices: si,l,m. I am unsure why the second and third indices are concatenated. In equations (2)-(5) we see that also a 2 index version is used.

The second problem I see is equation (6). I suspect this should read:

image

Equation (7) does not look correct to me either. Could be they really mean:

image 

Equation (10) introduces suddenly a xi,j,m which probably just should read xi,m. This equation is nonlinear as presented but probably can be linearized easily. In general the capacity constraint for renewable resources is indexed by t, but here in eq (10) the authors propose to sum over t. This cannot be correct either.

To make things worse, the presented solution is of the small sample problem is incorrect. They show:

image

When we look at s(2,v,2) we see:

job part mode start time
2 1 2 0
2 2 2 0
2 3 2 1

I.e. part 1 and 2 are executed in the same time slot.

This is a small model but these typos do not make it very easy to reproduce results.

Update: similar mistakes are found in an earlier paper: www.journal-archieves14.webs.com/636-642.pdf. So these are not just typos. I suspect the model was done in Excel, for the following reasons:

  • Excel models are always very messy
  • they are often difficult to translate one-to-one to a well formulated mathematical model
  • Excel handles non-linear models
  • Excel has a 2d grid, which may explain there preference for 2d variables.

When developing a non-trivial model it is often a good idea to use a modeling language such as AMPL or GAMS, as this in sense will check your formulation. The above mistakes would probably not have been made in that case. Excel provides very limited support for more complex models, and from experience I can say Excel models are difficult to understand and debug. This may well be another piece of support for this.

Anyway, this is a good example how not to publish models. Of course in journals with better reviewers a paper like this would probably not have been accepted. The presented model equations and results are incorrect.

My solution looks like:

image

The model has no penalty on preemption, so there is no incentive to make jobs as much as possible uninterrupted.

Thursday, August 30, 2012

Cplex QP problems

For a reasonable sized continuous QP problem, the default Cplex settings indicate problems:

Reading data...
Starting Cplex...
Tried aggregator 1 time.
QP Presolve eliminated 51 rows and 60 columns.
Aggregator did 600 substitutions.
Reduced QP has 1404 rows, 25401 columns, and 58593 nonzeros.
Reduced QP objective Q matrix has 24979 nonzeros.
Presolve time =    0.03 sec.
Parallel mode: none, using 1 thread for barrier
Number of nonzeros in lower triangle of A*A' = 23873
Using Approximate Minimum Degree ordering
Total time for automatic ordering = 0.00 sec.
Summary statistics for Cholesky factor:
  Rows in Factor            = 1404
  Integer space required    = 12305
  Total non-zeros in factor = 37816
  Total FP ops to factor    = 1398232
Itn      Primal Obj        Dual Obj  Prim Inf Upper Inf  Dual Inf         
   0  1.1269359e+016 -1.1269360e+016 1.03e+006 0.00e+000 6.83e+014
   1  1.3889591e+015 -1.3889592e+015 3.62e+005 0.00e+000 2.40e+014
   2  5.4393422e+013 -5.4393451e+013 7.16e+004 0.00e+000 4.75e+013
   3  4.9247681e+011 -4.9248040e+011 6.82e+003 0.00e+000 4.51e+012
   4  2.8122639e+009 -2.8128116e+009 5.15e+002 0.00e+000 3.41e+011
   5  1.2862048e+008 -1.2878713e+008 1.10e+002 0.00e+000 7.29e+010
   6  1.6614552e+006 -1.6932044e+006 1.25e+001 0.00e+000 8.26e+009
   7  3.0507032e+003 -9.1387053e+003 1.16e-001 0.00e+000 7.70e+007
   8  8.8731205e+002 -2.6509477e+003 3.31e-002 0.00e+000 2.19e+007
   9  3.2742736e+002 -5.8146949e+002 8.03e-003 0.00e+000 5.32e+006
  10  2.4615010e+002 -2.3471413e+002 4.40e-003 0.00e+000 2.92e+006
  11  2.0803982e+002 -3.1756372e+001 2.26e-003 0.00e+000 1.50e+006
  12  1.8984146e+002  9.9701542e+001 8.66e-004 0.00e+000 5.74e+005
  13  1.8441405e+002  1.5886308e+002 2.46e-004 0.00e+000 1.63e+005
  14  1.8341125e+002  1.7590746e+002 7.24e-005 0.00e+000 4.80e+004
  15  1.8320505e+002  1.8209849e+002 1.04e-005 0.00e+000 6.88e+003
  16  1.8318478e+002  1.8309471e+002 7.96e-007 0.00e+000 5.27e+002
  17  1.8318341e+002  1.8318113e+002 1.57e-008 0.00e+000 1.04e+001
  18  1.8318336e+002  1.8318333e+002 1.14e-010 0.00e+000 7.37e-002
  19  1.8318506e+002  1.8317840e+002 3.79e-011 0.00e+000 3.91e-004
  20  1.8318506e+002  1.8317840e+002 3.12e-007 0.00e+000 3.44e+004
  *   1.8318506e+002  1.8317840e+002 3.79e-011 0.00e+000 3.91e-004

Total time on 1 threads =    0.19 sec.
QP status(6): non-optimal

Solution available but not proven optimal due to numerical difficulties.

This is a matrix balancing problem, where we try to repair economic data matrices after dropping small values, while maintaining some important economic identities.

First thing I tried was to use primal and dual simplex methods, but these turned out not very attractive alternatives (primal simplex took a long time, and dual simplex was infeasible after unscaling). The best option turned out to be using the opfion  numericalemphasis. Now it solves fine. Of course I believe that I should not have to do this: Cplex itself should understand better than me that it is in trouble and should try to recover from this in a more intelligent way than I can.

Thursday, August 23, 2012

Not such a good example data set

In the paper

Hybrid Approach for Machine Scheduling Optimization in Custom Furniture Industry
Juan C. Vidal, Manuel Mucientes, Alberto Bugarin, and Manuel Lama
Department of Electronics and Computer Science
University of Santiago de Compostela, E-15782 Spain
http://www.gsi.dec.usc.es/printable/node/793

a data set is used, which I recognized from http://yetanothermathprogrammingconsultant.blogspot.com/2012/08/problems-reproducing-results.html. It is just a bit smaller:

image

The main addition is the addition of due dates. The idea is to develop a bi-criteria model that minimizes the makespan and the total tardiness. Unfortunately when we just minimize the makespan, we get a solution with all jobs being finished on-time:

----    179 PARAMETER results 

                   start        proc      finish     machine         due

j1      .op1                       1           1           1
j1      .op2           5           1           6           4           6
j1      .op3           1           1           2           3
j2      .op1           4           1           5           4
j2      .op2           1           2           3           1
j2      .op3           5           2           7           3           7
j3      .op1                       5           5           2
j3      .op2           6           1           7           4
j3      .op3           7           1           8           2           8
j4      .op1                       4           4           4
j4      .op2           5           2           7           2
j4      .op3           7           1           8           4           9
makespan.                                      8

image

I.e. for this data we just can minimize the makespan and we are done. This is really boring. It would be better to have a data set that really needs to explore an efficient frontier. I tried with some different due dates e.g.

parameter duedate(j) /
  J1 3
  J2 9
  J3 9
  J4 9
/;

but that still makes the problem too easy (just two efficient points easily found by solving for each of the objectives).

I am working (in another context) on some MIP formulations for these type of problems. Hence my interest. Ok, we’ll keep looking for better examples…


Update: I changed the data a bit (added two more jobs). Now at least I get three efficient solutions:

image

The smooth line connecting the efficient points is for beautification: the line does not really form the efficient frontier. This is because the problem is discrete.  

Wednesday, August 22, 2012

The Comparative Productivity of Programming Languages

http://www.drdobbs.com/jvm/the-comparative-productivity-of-programm/240005881

I would have expected programmers to be about as efficient in C# as in Java. Of course it is possible the underlying statistical model is not correct for making a statement like this. E.g. in the sample there were many seasoned Java programmers but on the other hand many relative junior C# programmers. If so, was this taken care of in the regression?

Sunday, August 19, 2012

Surprises in the log file

Sometimes I see messages in the log file of a MIP solver that are quite worrying. Here is one from GAMS/Cplex:

Proven optimal solution.

MIP Solution:           15.353413    (10612 iterations, 238 nodes)
Final Solve:            17.208664    (82 iterations)

The final solve is a extra LP GAMS wants to solve after fixing all integer variables (the reason is they want to report marginals i.e. duals and reduced cost). Obviously the two objectives should be (almost) the same. Here we see a large difference, indicating we are probably in deep trouble.