Sunday, August 19, 2018

Julia 1.0


Julia 1.0 is out:


Julia 1 console with retro style ascii art

For optimization modeling, the Julia JuMP package is a good tool. The performance of Julia/JuMP is impressive [2]. And the Jupyter [4] notebook interface is really a pleasure to use when playing with the model.

The JuMP models I have seen, used integers for indexing. (Not only from the JuMP documentation and examples but also real models people were working on). This is a major drawback IMHO: there is limited protection against errors (no type/domain checking). Better is to index by strings. It gives better, more descriptive output and also checking for incorrect indices is better. Basically you want a proper error if you say x[j,i] instead of x[i,j]. Similarly when using demand['february','region3'] instead of demand['region3','february']. This is lost when using demand[2,3]. May be I need to create some motivating examples for this. An example of indexing by strings is the Steel model [1], where dicts are used that index data and variables by strings. The model uses integers for the time periods -- I prefer to have those also labeled something like t1,t2,t3,t4. Of course, in practice they will be labeled by something like jan,feb,mar,apr or may be week11,week12,week13,week14. I often use the rule: the way you want labels to appear in your Excel report (say), should also be used in the model. I am not 100% sure why indexing by integers is so popular in JuMP models (or at least the ones I was studying). I suspect that the fact that matrices (arrays) are an important data structure in Julia, plays a role here. Julia has data frames (a concept popularized by R), but I don't think they are often used directly in optimization models.

Warning:  The latest release of JuMP (based on MathProgBase) is not compatible with Julia 0.7 or 1.0. [3]

Update: I fixed my incorrect statement about indexing by integers only. (I will try to expand on this).

References


  1. SteelT3 model translated from the AMPL book, https://github.com/JuliaOpt/JuMP.jl/blob/release-0.18/examples/steelT3.jl
  2. Iain Dunning, Joey Huchette, Miles Lubin, JuMP: A modeling language for mathematical optimization, SIAM Review, 59(2), pp. 295–320, 2017 (preprint at: http://www.optimization-online.org/DB_HTML/2015/04/4891.html).
  3. https://github.com/JuliaOpt/JuMP.jl
  4. http://jupyter.org/

Thursday, August 9, 2018

The best way to debug infeasible models

Well, there is no universally best way. But one approach I like to suggest is: use (or construct) a known feasible solution and fix decision variables. This approach is not often mentioned. Most algorithm suppliers say: just use IIS [1]. In my opinion (and based on experience), fixing is often more reliable: it will pin-point infeasible constraints. In addition, fixing is conceptually much simpler than looking at IIS output. The results of fixing does not require much explanation. Sometimes lo-tech is better than hi-tech [2].

Example: a transportation problem


Let's use a simple transportation problem as an example: \[\bbox[lightcyan,10px,border:3px solid darkblue]{\begin{align}\min&\sum_{i,j} c_{i,j} x_{i,j}\\ & \sum_i x_{i,j} \ge d_j& \forall j&\text{  (demand)}\\ & \sum_j x_{i,j} \le s_i& \forall i&\text{  (supply)}\\  &x_{i,j} \ge 0\end{align}}\]
The data looks like:


----     45 PARAMETER c  transport cost

             new-york     chicago      topeka

seattle         0.225       0.153       0.162
san-diego       0.225       0.162       0.126


----     45 PARAMETER d  demand at market j

new-york 325.000,    chicago  300.000,    topeka   275.000


----     45 PARAMETER s  capacity of plant i

seattle   350.000,    san-diego 600.000

When we deal with infeasibilities, we can ignore the objective: this will never have a role. So in the data above, we don't need to worry about parameter \(c\).

A feasible solution is easily constructed:

Feasible solution
Let's create a bug: assume somehow \(s_i\) arrived incorrectly at 80% of the current values. I.e.


---     70 PARAMETER s  capacity of plant i

seattle   280.000,    san-diego 480.000

The model is now infeasible. The reason is the total supply is too small to meet total demand.

The GAMS equation listing will show the individual equations (before solving):


---- demand  =G=  satisfy demand at market j

demand(new-york)..  x(seattle,new-york) + x(san-diego,new-york) =G= 325 ; (LHS = 0, INFES = 325 ****)
     
demand(chicago)..  x(seattle,chicago) + x(san-diego,chicago) =G= 300 ; (LHS = 0, INFES = 300 ****)
     
demand(topeka)..  x(seattle,topeka) + x(san-diego,topeka) =G= 275 ; (LHS = 0, INFES = 275 ****)
     

---- supply  =L=  observe supply limit at plant i

supply(seattle)..  x(seattle,new-york) + x(seattle,chicago) + x(seattle,topeka) =L= 280 ; (LHS = 0)
     
supply(san-diego)..  x(san-diego,new-york) + x(san-diego,chicago) + x(san-diego,topeka) =L= 480 ; (LHS = 0)

This is a useful listing to look at. The initial values for the variables are zero here, so the demand equations are infeasible at the initial point. The supply constraints are feasible at the initial point. It is noted that the variables are always feasible with respect to their bounds. GAMS makes sure the variable levels are always within their bounds at this initial point.

One good way to prevent even to pass the model on to the solver is to add a data check:
abort$(sum(i,s(i)) < sum(j,d(j)) - 0.01) "Supply too small for demand";
Let's see what solvers do with this infeasible model. I'll try three different approaches:

  • Solve as is, and see how different solver report a solution for this infeasible model. We'll see there is little uniformity.
  • Run with IIS (Irreducible Infeasible Set). This is often advised as good tool to inspect and diagnose infeasibilities. I am usually less successful when using this approach.
  • Fix decision variables to a known feasible solution, and see what is reported. This is often my preferred approach.

Solve and look at the solution


The best solution will minimize the sum of the infeasibilities (this sum is 140) and properly mark the infeasible rows and columns. Let's see how the solver do on this.

Cplex


---- EQU demand  satisfy demand at market j

                LOWER          LEVEL          UPPER         MARGINAL

new-york       325.0000       325.0000        +INF            0.2250      
chicago        300.0000       300.0000        +INF            0.1530      
topeka         275.0000       275.0000        +INF            0.1260      

---- EQU supply  observe supply limit at plant i

                 LOWER          LEVEL          UPPER         MARGINAL

seattle          -INF          280.0000       280.0000         EPS         
san-diego        -INF          620.0000       480.0000          .     INFES

---- VAR x  shipment quantities in cases

                          LOWER          LEVEL          UPPER         MARGINAL

seattle  .new-york          .           -20.0000        +INF             .     INFES
seattle  .chicago           .           300.0000        +INF             .          
seattle  .topeka            .              .            +INF            0.0360      
san-diego.new-york          .           345.0000        +INF             .          
san-diego.chicago           .              .            +INF            0.0090      
san-diego.topeka            .           275.0000        +INF             .          

**** REPORT SUMMARY :        0     NONOPT
                             2 INFEASIBLE (INFES)
                    SUM        160.0000
                    MAX        140.0000
                    MEAN        80.0000
                             0  UNBOUNDED

We see there are two reported infeasibilities. One of them is an infeasible variable. Interestingly, this is not the solution with the minimum phase 1 objective (i.e. minimum sum of infeasibilities). Here we have a total infeasibility of 160 while the optimal phase 1 objective is 140.

MINOS, CONOPT


A proper minimum phase 1 solution with a total infeasibility of 140 is reported by MINOS and Conopt:


---- EQU demand  satisfy demand at market j

                LOWER          LEVEL          UPPER         MARGINAL

new-york       325.0000       325.0000        +INF            0.0039      
chicago        300.0000       300.0000        +INF            0.0039      
topeka         275.0000       135.0000        +INF            0.0039 INFES

---- EQU supply  observe supply limit at plant i

                 LOWER          LEVEL          UPPER         MARGINAL

seattle          -INF          280.0000       280.0000        -0.0039      
san-diego        -INF          480.0000       480.0000        -0.0039      

---- VAR x  shipment quantities in cases

                          LOWER          LEVEL          UPPER         MARGINAL

seattle  .new-york          .              .            +INF            EPS         
seattle  .chicago           .           145.0000        +INF             .          
seattle  .topeka            .           135.0000        +INF             .          
san-diego.new-york          .           325.0000        +INF             .          
san-diego.chicago           .           155.0000        +INF             .          
san-diego.topeka            .              .            +INF            EPS         


**** REPORT SUMMARY :        0     NONOPT
                             1 INFEASIBLE (INFES)
                    SUM        140.0000
                    MAX        140.0000
                    MEAN       140.0000
                             0  UNBOUNDED
                             0     ERRORS

In both cases the solver distributes infeasibilities in a way that is unrelated to the original problem: we see a demand equation is marked  (while both supply equations are the real culprit here).

Gurobi


---- EQU demand  satisfy demand at market j

                LOWER          LEVEL          UPPER         MARGINAL

new-york       325.0000          .            +INF           -1.0000      
chicago        300.0000          .            +INF           -1.0000      
topeka         275.0000          .            +INF           -1.0000      

---- EQU supply  observe supply limit at plant i

                 LOWER          LEVEL          UPPER         MARGINAL

seattle          -INF             .           280.0000         1.0000      
san-diego        -INF             .           480.0000         1.0000      

---- VAR x  shipment quantities in cases

                          LOWER          LEVEL          UPPER         MARGINAL

seattle  .new-york          .              .            +INF             .          
seattle  .chicago           .              .            +INF             .          
seattle  .topeka            .              .            +INF             .          
san-diego.new-york          .              .            +INF             .          
san-diego.chicago           .              .            +INF             .          
san-diego.topeka            .              .            +INF             .          


**** REPORT SUMMARY :        0     NONOPT
                             0 INFEASIBLE
                             0  UNBOUNDED

This is just a bogus solution: all levels are zero. Infeasibilities are not properly marked. The number and sum of infeasibilities is also wrong.

The conclusion must be: many solvers do not do a good job of returning a proper phase 1 solution that minimizes the sum of the infeasibilities. I always find this somewhat disappointing. I like to know what the minimum sum of infeasibilities is: the size can give a clue about the source of the infeasibilities.

IIS: Irreducable Infeasible Set


Many modern solvers have a facility to use an  IIS (Irreducable Infeasible Set) algorithm [3] to return groups of equations such that when one equation is removed thit set of equations becomes feasible.

Here is the IIS reported by Gurobi:


LP status(3): Model was proven to be infeasible.
Computing IIS...
An IIS is a set equations and variables (ie a submodel) which is
infeasible but becomes feasible if any one equation or variable bound
is dropped.

A problem may contain several independent IISs but only one will be
found per run.
Number of equations in the IIS: 5
demand(new-york) > 325
demand(chicago) > 300
demand(topeka) > 275
supply(seattle) < 280
supply(san-diego) < 480
Number of variables in the IIS: 0

Cplex gives the same thing:

Minimal conflict found.

A conflict is a set equations and variables (ie a submodel) which is
infeasible but becomes feasible if any one equation or variable bound
is dropped.

A problem may contain several independent conflicts but only one will be
found per run.

Number of equations in the conflict:  5.
lower: demand(new-york) > 325
lower: demand(chicago) > 300
lower: demand(topeka) > 275
upper: supply(seattle) < 280
upper: supply(san-diego) < 480

Number of variables in the conflict:  0.


The IIS set has all constraints of the model. This actually means: if we drop any of the constraints of our model, the resulting model will be feasible. Well, that is interesting, but it does not bring me closer to the conclusion that the supply capacities are wrong.

Fixing: the best approach for this problem


The best approach is to fix the variable to our feasible solution. In GAMS, we can do this with:

table solx(i,j)
              
new-york       chicago        topeka
  
seattle       325
  
san-diego                    300            275
;
x.fx(i,j) = solx(i,j);

The equation listing tells us exactly what is wrong:


---- demand  =G=  satisfy demand at market j

demand(new-york)..  x(seattle,new-york) + x(san-diego,new-york) =G= 325 ; (LHS = 325)
     
demand(chicago)..  x(seattle,chicago) + x(san-diego,chicago) =G= 300 ; (LHS = 300)
     
demand(topeka)..  x(seattle,topeka) + x(san-diego,topeka) =G= 275 ; (LHS = 275)
     

---- supply  =L=  observe supply limit at plant i

supply(seattle)..  x(seattle,new-york) + x(seattle,chicago) + x(seattle,topeka) =L= 280 ; (LHS = 325, INFES = 45 ****)
     
supply(san-diego)..  x(san-diego,new-york) + x(san-diego,chicago) + x(san-diego,topeka) =L= 480 ;
     
      (LHS = 575, INFES = 95 ****)

The initial point with the fixed levels for the variables, yields infeasibilities for the supply equation. The solver will also pinpoint a single infeasibility in the log:

Infeasibility row 'supply(seattle)':  0 <= -45.
Only one infeasibility is reported here, This is because the presolver handled this. When a presolver finds the model is infeasible most often it can produce a good message, but it will only report one infeasibility. The infeasiblity is reported as 0 <= -45. This is a bit less clear than we want. Basically the left-hand side of the inequality x(seattle,new-york) + x(seattle,chicago) + x(seattle,topeka) \(\le\) 280 has become empty as all variables are replaced by their fixed values. The constants are moved to the right-hand side. The constraint is therefore re-interpreted as \(0 \le 280 - 325 = -45\). This is clearly infeasible.

Note:
However, the presolver can also lead to the dreaded: 
Model was proven to be either infeasible or unbounded. 
The solver puts premium on minimization of its time. One could say, the real problem a solver solves is: minimize the time spent on solving the problem. In case of this message, the problem to find out whether the model is really unbounded or infeasible is off-loaded to the user. In my opinion, the users time is more valuable, so the solver should spent a little bit of extra time to figure out if the problem is actually infeasible or unbounded.
GAMS can do a more strict test when we add the model setting holdfixed=1. This will make all fixed variables constants, just like parameters. When we do:

transport.holdfixed=1;
solve transport using lp minimizing z;

we'll see:


**** Exec Error at line 62: Equation infeasible due to rhs value

**** INFEASIBLE EQUATIONS ...

---- supply  =L=  observe supply limit at plant i

supply(seattle)..  0 =L= -45 ; (LHS = 0, INFES = 45 ****)
     
supply(san-diego)..  0 =L= -95 ; (LHS = 0, INFES = 95 ****)

In this case the model is not even passed on to the solver.

Some notes on fixing:

  • Often you don't need to fix all variables in a model. Just fixing the central variables may be enough: the other variables can be calculated from them in an unambiguous way. If you only fix a few central variables, you need to rely on the solver messages to pinpoint the infeasibility. As the initial point is not complete, we cannot rely on the GAMS equation listing.
  • Make sure you don't destroy any bounds on the variables. 
  • Bounds can play an important role in the model being infeasible.
  • This method also works when the problem is integer infeasible (but LP feasible).

An elastic formulation


If you want to protect your models against infeasibilities, it may help to formulate an elastic version. This means that you allow to violate constraints, but at a cost. In other words: convert hard constraints into soft ones. For example, a manpower constraint can be made elastic by allowing to hire temporary workers (at a higher cost).

An elastic formulation would make the problem always feasible. We can make the supply equations elastic by allowing to oversupply beyond our capacity. E.g. by outsourcing and supplying from other suppliers at a high cost. Such a formulation can look like: \[\begin{align}\min&\sum_{i,j} c_{i,j} x_{i,j} +  C_e \sum_ i e_i\\ & \sum_i x_{i,j} \ge d_j& \forall j&\text{  (demand)}\\ & \sum_j x_{i,j} \le s_i+e_i& \forall i&\text{  (supply)}\\  &x_{i,j} \ge 0, e_i \ge 0\end{align}\] Note that we only add slacks to the supply equation. This is enough to make the model always feasible. We don't need to make the demand equation also elastic. When we solve this elastic model we see:

                           LOWER          LEVEL          UPPER         MARGINAL

---- EQU cost2               .              .              .             1.0000      

  cost2  new objective: add cost extra supply

---- EQU demand  satisfy demand at market j

                LOWER          LEVEL          UPPER         MARGINAL

new-york       325.0000       325.0000        +INF          999.2250      
chicago        300.0000       300.0000        +INF          999.1530      
topeka         275.0000       275.0000        +INF          999.1260      

---- EQU supply2  allow for extra supply

                 LOWER          LEVEL          UPPER         MARGINAL

seattle          -INF          280.0000       280.0000      -999.0000      
san-diego        -INF          480.0000       480.0000      -999.0000      

---- VAR x  shipment quantities in cases

                          LOWER          LEVEL          UPPER         MARGINAL

seattle  .new-york          .           120.0000        +INF             .          
seattle  .chicago           .           300.0000        +INF             .          
seattle  .topeka            .              .            +INF            0.0360      
san-diego.new-york          .           205.0000        +INF             .          
san-diego.chicago           .              .            +INF            0.0090      
san-diego.topeka            .           275.0000        +INF             .          

---- VAR e  extra supply

                 LOWER          LEVEL          UPPER         MARGINAL

seattle            .           140.0000        +INF             .          
san-diego          .              .            +INF            EPS         

                           LOWER          LEVEL          UPPER         MARGINAL

---- VAR tc                -INF       140013.6750        +INF             .          

  tc  total cost


**** REPORT SUMMARY :        0     NONOPT
                             0 INFEASIBLE
                             0  UNBOUNDED

I used a unit cost of \(C_e=999\) for this extra supply. Observe that we added 140 units of expensive, extra supply.  Obviously this number is the same as the optimal phase 1 objective reported earlier by Minos and Conopt.

Conclusion


If you know (or can construct) a feasible point, fixing variables to this point is an extremely useful tool to find out what caused the problem to be infeasible. Of course, constructing a feasible solution is not always easy, so this method is not suited for all cases. For other models it may be surprisingly easy to generate a feasible solution. For instance, for a machine scheduling model, just order jobs by their release date on a single machine.

The GAMS output for different solvers is unfortunately difficult to interpret: some of the output is contradictory, and output is spread around in log and listing files. Solvers are not very consistent in what they report. Depending on whether the presolver or the solver itself detects infeasibilities, the reporting may be totally differently. This is all somewhat messy.

Some solvers like to report a Farkas certificate of infeasibility [4]. There are very enthusiastic proponents of this approach. I think it is fair to say that not all users are quite comfortable with this type of reporting. When a feasible solution is available, fixing, to me, still looks simpler and more accurate.

Finally I want to mention that unbounded models are easier to debug. Just put a bound on the objective, e.g.: \[\begin{align}\min\>&z \\ & z = c^Tx \\ &  z \ge -1000000\\ &Ax=b \\ & \ell \le x \le u\end{align}\] and inspect the solution to for large (negative) values.

References


  1. encountering INFEASIBLE status in Gurobi Matlab interface, https://stackoverflow.com/questions/51743892/encountering-infeasible-status-in-gurobi-matlab-interface
  2. K best solutions for an assignment problem, https://yetanothermathprogrammingconsultant.blogspot.com/2018/04/k-best-solutions-for-assignment-problem.html
  3. O. Guieu and J.W. Chinneck (1999), "Analyzing Infeasible Mixed-Integer and Integer Linear Programs", INFORMS Journal on Computing, vol. 11, no. 1, pp. 63-77.
  4. Erling D. Andersen, How to use Farkas’ lemma to say something important about infeasible linear problems, https://docs.mosek.com/whitepapers/infeas.pdf

Friday, August 3, 2018

Sudoku++, MIP vs Constraint Solvers

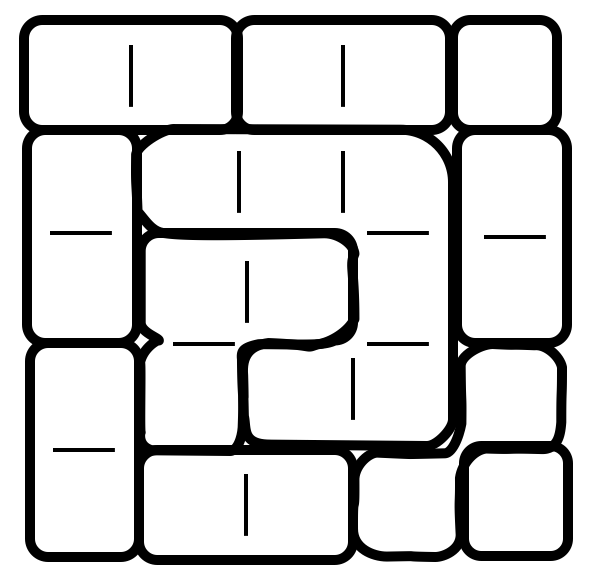
In [1] a variant of the Sudoku puzzle is presented:

Sudoku Variant 
Place numbers in the grid so that each row and each column contain the numbers 1 through 5 and the sums of numbers in the outlined regions are all different.


When we want to model this problem, we basically have three sets of constraints:

  1. Each row \(i\) has unique values \(1,\dots,5\)
  2. Each column \(j\) has unique values \(1,\dots,5\)
  3. Each region \(r\) has unique sums 
This leads to repeated use of the all-different constraint.

Below I will try to model this problem in different ways:
  1. A MIP formulation using GAMS. When using integer programming we don't have an all-different construct. However, with a little bit of effort, we can implement this using linear constraints.
  2. A Python implementation using the Z3 SMT solver from Microsoft. 
  3. A Minizinc implementation using the Gecode constraint programming solver.
The last two approaches allow us to use all-different directly.

In addition, I will discuss how we can verify that there there is only one unique solution to this problem. 

MIP Model


As usual we will use a binary variable [2]: \[x_{i,j,k} = \begin{cases} 1 & \text{if cell $(i,j)$ has value $k$}\\ 0 & \text{otherwise}\end{cases}\]

Using this definition, the row and column uniqueness constraints are easy using assignment constraints: \[\begin{align} & \sum_i x_{i,j,k} = 1 & \forall j,k \\ & \sum_j x_{i,j,k} = 1 & \forall i,k \\  &\sum_k x_{i,j,k} = 1 &\forall i,j\end{align}\] These assignment constraint effectively implement what is known as all-different constraints in constraint programming. See [3] for different MIP formulations for these all-different constraints.

Let's indicate a region by \(r\).  We can calculate the value of a region by: \[v_r = \sum_{(i,j)|R_{i,j,r}} \sum_k k\> x_{i,j,k} \] We sum over cells in region \(r\). Now we have to add an all-different constraint: \[\text{all-different}(v_k)\] This is a slightly different all-different constraint from the ones we discussed before. Here we don't enumerate all possible values.

One way to model this, is the following. Interpret the problem as: \[ v_r \le v_{r'} - 1 \textbf{ or } v_r \ge v_{r'} + 1 \>\> \forall r\ne r'\] We can model this with binary variables \(\delta\): \[\begin{align} & v_r \le v_{r'} - 1 + M\delta_{r,r'}\\ & v_r \ge v_{r'} + 1 -M (1-\delta_{r,r'})\\ &  \delta_{r,r'} \in \{0,1\} \end{align}\] Instead of \(\forall r\ne r'\), we can save some equations and variables by only generating these constraints \(\forall i\lt j\). We need a good value for \(M\). If the largest possible value of a region is \(L\), then \(M=L+1\). The largest region has 6 cells, so one easy bound is \(L=6 \times 5=30\). With some more analysis we can reduce this even further, but I am happy with this bound.

Interestingly, we used in this model two different ways to implement all-different constraints: one through assignment constraints and the other by an or constraint.

GAMS Model: Mixed Integer Programming


The GAMS model can look like:


sets
  i
'rows' /r1*r5/
  j
'columns' /c1*c5/
  k
'values' /1*5/
  r
'regions' /r1*r11/
;

table grid(i,j) 'encoding of regions'
  
c1  c2  c3  c4  c5
r1  1   1   2   2   3
r2  4   5   5   5   6
r3  4   7   7   5   6
r4  8   7   5   5  10
r5  8   9   9  10  11
;


set region(i,j,r) '(i,j) is in r';
region(i,j,r) = grid(i,j) =
ord(r);

alias(r,r1,r2);
set rr(r1,r2) 'compare r1,r2';
rr(r1,r2) =
ord(r1)<ord(r2);

parameter len(r) 'length of a region';
len(r) =
sum(region(i,j,r),1);

scalar M '1+largest value of a region';
M = 1+
smax(r,len(r)) * card(k);
display M;

binary variables
  x(i,j,k)     
'assign value k to cell (i,j)'
  delta(r1,r2) 
'used to model OR constraint'
;
variables
  v(r)  
'value of a region'
  z     
'dummy objective'
;

equations
   value(i,j)  
'unique value in cell'
   row(i,k)    
'unique value in row'
   column(j,k) 
'unique value in column'

   sumregion(r) 
'sum of cell values in region'

   alldiff1(r1,r2) 
'all-different constraint'
   alldiff2(r1,r2) 
'all-different constraint'

   objective 
'dummy objective'
;

*
* assignment constraints
*
value(i,j).. 
sum(k, x(i,j,k)) =e= 1;
row(i,k)..   
sum(j, x(i,j,k)) =e= 1;
column(j,k)..
sum(i, x(i,j,k)) =e= 1;

*
* region values
*
sumregion(r).. v(r) =e=
sum((region(i,j,r),k), x(i,j,k) * k.val);

*
* all-different(v)
*
alldiff1(rr(r1,r2))..  v(r1) =l= v(r2) - 1 + M*delta(r1,r2);
alldiff2(rr(r1,r2))..  v(r1) =g= v(r2) + 1 - M*(1-delta(r1,r2));

*
* dummy objective
*
objective.. z =e= 0;


model m1 /all/;
solve m1 minimizing z using mip;


*
* reporting
*
parameter xv(i,j) 'cell values';
xv(i,j) =
sum(k, x.l(i,j,k) * k.val);
option grid:0,xv:0,v:0;
display grid,xv,v.l;


The results look like:


----     88 PARAMETER grid  encoding of regions

            c1          c2          c3          c4          c5

r1           1           1           2           2           3
r2           4           5           5           5           6
r3           4           7           7           5           6
r4           8           7           5           5          10
r5           8           9           9          10          11


----     88 PARAMETER xv  cell values

            c1          c2          c3          c4          c5

r1           1           3           5           4           2
r2           5           1           4           2           3
r3           3           5           2           1           4
r4           2           4           1           3           5
r5           4           2           3           5           1


----     88 VARIABLE v.L  value of a region

r1   4,    r2   9,    r3   2,    r4   8,    r5  12,    r6   7,    r7  11
r8   6,    r9   5,    r10 10,    r11  1

After playing with my crayons, we have:


This is not a super easy model to solve. Standard Sudoku models are typically solved in the presolve phase, so the MIP solver does not have to any branching. This is not the case with this model:


        Nodes                                         Cuts/
   Node  Left     Objective  IInf  Best Integer    Best Bound    ItCnt     Gap

      0     0        0.0000    61                      0.0000       99         
      0     0        0.0000     2                     Cuts: 2      101         
      0     0        0.0000     3                     Cuts: 6      106         
      0     0        0.0000     3                 ZeroHalf: 2      108         
      0     2        0.0000     3                      0.0000      108         
Elapsed time = 0.25 sec. (25.37 ticks, tree = 0.01 MB, solutions = 0)
   1338   159        0.0000     3                      0.0000    13389         
                                                      Cuts: 8                  
   2012   123    infeasible                            0.0000    24769         
   2822    96    infeasible                            0.0000    38178         
   3072    93        0.0000    67                      0.0000    42948         
   3486   107        0.0000    38                      0.0000    50692         
                                                     Cuts: 10                  
   3909   123        0.0000    55                      0.0000    59355         
   4040   130        0.0000    45                      0.0000    62204         
   4150    39        0.0000    68                      0.0000    64390         
*  4234     0      integral     0        0.0000        0.0000    66184    0.00%
Found incumbent of value 0.000000 after 9.97 sec. (2491.49 ticks)

The solver has to do some real work here: 4234 nodes and 66184 simplex iterations. As this is a feasibility problem, we can stop as soon as we find a feasible integer solution.

Uniqueness of the solution


It is easy to add a constraint that checks the uniqueness of this solution. Let's first record the current solution: \(a_{i,j,k} = x^*_{i,j,k}\). Now add the constraint:\[\sum_{i,j,k} a_{i,j,k} x_{i,j,k} \le 5^2-1\] Solve this model and check the status. If this new problem is infeasible, we know our original solution was unique.

When I did this the solver showed:

MIP status(119): integer infeasible or unbounded 

In general, I find this always a bit a of disappointing message. The solver should be able to make up its mind (even if it takes a few micro-seconds: the user's time is really more important than a little bit of computation time for the solver).

In this case it is even more troubling. The model has a dummy objective \(z=0\). So if the solver says, well, may be the model is unbounded, it clearly was not paying attention.

Constraint solver: Z3/Python


A constraint solver typically has built-in support for the all-different constraint. This allows us to use \(x_{i,j} \in 1,\dots,5\) directly as main variable. A Z3 Python model can look like:


from z3 import *

grid = [[ 1,   1,   2,   2,   3],
        [ 4,   5,   5,   5,   6],
        [ 4,   7,   7,   5,   6],
        [ 8,   7,   5,   5,  10],
        [ 8,   9,   9,  10,  11]]


ROWS = range(len(grid))     # 0..rows-1
COLS = range(len(grid[0]))  # 0..cols-1
MAX = 5                     # 1 <= x[i,j] <= MAX

REGIONS = set([grid[i][j] for i in ROWS for j in COLS])  # region numbers

# for each region form a list of (i,j) tuples
region = [[] for r in REGIONS]
for i in ROWS:
    for j in COLS:
        r = grid[i][j]
        region[r-1] += [(i,j)]

#
# decision variables
#
X = [ [ Int("x%d.%d" % (i+1, j+1)) for j in COLS ] for i in ROWS ]
V = [ Int("v%d" % r) for r in REGIONS]

#
# constraints
#
Bounds = And([And(X[i][j] >= 1,X[i][j] <= MAX) for i in ROWS for j in COLS ])
UniqRows = And([ Distinct([X[i][j] for j in COLS]) for i in ROWS])
UniqCols = And([ Distinct([X[i][j] for i in ROWS]) for j in COLS])
UniqRegionValues = Distinct([V[r-1] for r in REGIONS])
CalcV = And([V[r-1] == Sum([X[i][j] for (i,j) in region[r-1]]) for r in REGIONS])

Cons = [Bounds, UniqRows, UniqCols, UniqRegionValues, CalcV]

#
# solve and print solution
#
s = Solver()
s.add(Cons)
if s.check() == sat:
     m = s.model()
     sol = [ [ m.evaluate(X[i][j]) for j in COLS] for i in ROWS]
     print(sol)

#
# Check for uniqueness
#
Forbid = Or([X[i][j] != sol[i][j] for i in ROWS for j in COLS])
s.add(Forbid)
if s.check() == sat:
     print("There is an alternative solution.")
else:
     print("Solution is unique.")

The output looks like:

[[1, 3, 5, 4, 2], [5, 1, 4, 2, 3], [3, 5, 2, 1, 4], [2, 4, 1, 3, 5], [4, 2, 3, 5, 1]]
Solution is unique.

In this model I tried to be efficient w.r.t constraint Calcv. Basically I tried to make only one pass over the data grid[i][j]. As this model is small, I probably could have dropped the calculation of region and immediate form the equation:

CalcV = And([V[r-1] == Sum([X[i][j] for i in COLS for j in ROWS if grid[i][j] == r]) for r in REGIONS])

This will make multiple passes over grid[i][j], but that is not a problem for a model with this size.

Constraint solver: Minizinc/Gecode


This model can be coded easily in Minizinc:


include "globals.mzn";

% number of rows, columns, regions
int: m = 5;
int: n = 5;
int: nr = 11;

% sets
set of int: I = 1..m;
set of int: J = 1..n;
set of int: R = 1..nr;

% grid
array[I,J] of int: grid;
grid = [| 1,   1,   2,   2,   3, 
        | 4,   5,   5,   5,   6, 
        | 4,   7,   7,   5,   6, 
        | 8,   7,   5,   5,  10, 
        | 8,   9,   9,  10,  11  |];
        
         
array[I,J] of var int: x; 
array[R] of var int: v;

constraint forall (i in I, j in J) ( x[i,j] >= 1 );
        
constraint forall (i in I, j in J) ( x[i,j] <= 5 );

constraint forall (i in I) ( alldifferent([ x[i,j] | j in J]) );

constraint forall (j in J) ( alldifferent([ x[i,j] | i in I]) );
                
constraint forall (r in R) ( v[r] = sum( [ x[i,j] | i in I, j in J where grid[i,j] = r] ) ); 

constraint alldifferent( [v[r] | r in R] );  
        
solve satisfy;


I did not optimize the constraint that calculates v[r]. I assume this version will make multiple passes over grid[i,j].

Gecode will try to find multiple solutions automatically. We don't need to add code for this like we did in the previous examples. Note that there is an option to limit the number of solutions (we should set this higher than one). In this case Gecode finds just one unique solution:


Compiling sudokux.mzn
Running sudokux.mzn
x = array2d(1..5 ,1..5 ,[1, 3, 5, 4, 2, 5, 1, 4, 2, 3, 3, 5, 2, 1, 4, 2, 4, 1, 3, 5, 4, 2, 3, 5, 1]);
v = array1d(1..11 ,[4, 9, 2, 8, 12, 7, 11, 6, 5, 10, 1]);
----------
==========
Finished in 333msec


Minizinc does not know how to print tables so unfortunately we get the results as a long list. It is possible to do your own formatting, but it strange that the default behavior is so user unfriendly. A better layout would really help.

Constraint solver: or-tools SAT/CP


Google's or-tools has a number of constraint solvers. Here we use the newer SAT/CP solver. The code is similar to the Z3 code. A little bit more code is needed to handle printing of multiple solution.

from ortools.sat.python import cp_model

#
# used in callback
#
class SolutionPrinter(cp_model.CpSolverSolutionCallback):
    """Print intermediate solutions."""

    def __init__(self,X):
        self.__solution_count = 0
        self.__x = X
  

    def NewSolution(self):
        self.__solution_count += 1
        R = range(len(self.__x))
        C = range(len(self.__x[0]))
        for i in R:
            for j in C:
                print(self.Value(self.__x[i][j]),end=" ")
            print()  
        print("---------------")

    
    def SolutionCount(self):
        return self.__solution_count    


grid = [[ 1,   1,   2,   2,   3],
        [ 4,   5,   5,   5,   6],
        [ 4,   7,   7,   5,   6],
        [ 8,   7,   5,   5,  10],
        [ 8,   9,   9,  10,  11]]


ROWS = range(len(grid))     # 0..rows-1
COLS = range(len(grid[0]))  # 0..cols-1
MAX = 5                     # 1 <= x[i,j] <= MAX

REGIONS = set([grid[i][j] for i in ROWS for j in COLS])  # region numbers, i.e. 1..11

# Create the SAT/CP model.
model = cp_model.CpModel()

#
# decision variables
#
X = [ [ model.NewIntVar(1,MAX,"x%d.%d" % (i+1, j+1)) for j in COLS ] for i in ROWS ]
V = [ model.NewIntVar(1,MAX*MAX,"v%d" % r) for r in REGIONS]

#
# constraints
#
for i in ROWS:
    model.AddAllDifferent([X[i][j] for j in COLS])

for j in COLS:
    model.AddAllDifferent([X[i][j] for i in ROWS])

model.AddAllDifferent([V[r-1] for r in REGIONS])

for r in REGIONS:
    model.Add(V[r-1] == sum([X[i][j] for i in COLS for j in ROWS if grid[i][j] == r ]))
    
    
#
# solve
#
solver = cp_model.CpSolver()
solution_printer = SolutionPrinter(X)
status = solver.SearchForAllSolutions(model, solution_printer)
print("Number of solutions found: %i" % solution_printer.SolutionCount())
print("Time:  %.2g seconds" % solver.WallTime())

The output looks like:
1 3 5 4 2 
5 1 4 2 3 
3 5 2 1 4 
2 4 1 3 5 
4 2 3 5 1 
---------------
Number of solutions found: 1
Time:  1 seconds


Performance


This is not a very easy model. Here are some timings:

ModelSolverSolution TimeNodesIterationsNotes
MIPCplex9.974234661841 thread
MIPCBC2761584053192290
ConstraintZ337.5
ConstraintGecode0.333
ConstraintOr-tools1

We see quite a variation in solution times. This is not unusual for combinatorial problems like this.

References


  1. https://blogs.wsj.com/puzzle/2018/05/24/varsity-math-week-141/ and https://momath.org/home/varsity-math/varsity-math-week-141/
  2. https://yetanothermathprogrammingconsultant.blogspot.com/2016/10/mip-modeling-from-sudoku-to-kenken.html
  3. Williams, H. Paul and Yan, Hong (2001), Representations of the 'all_different' predicate of constraint satisfaction in integer programming, Informs Journal on Computing, 13 (2). 96-103. 
  4. Z3, https://github.com/Z3Prover/z3
  5. Minizinc, http://www.minizinc.org/
  6. Gecode, http://www.gecode.org/